Date: Fri May 13 2011 - 13:42:25 MDT
Dear NCL users,
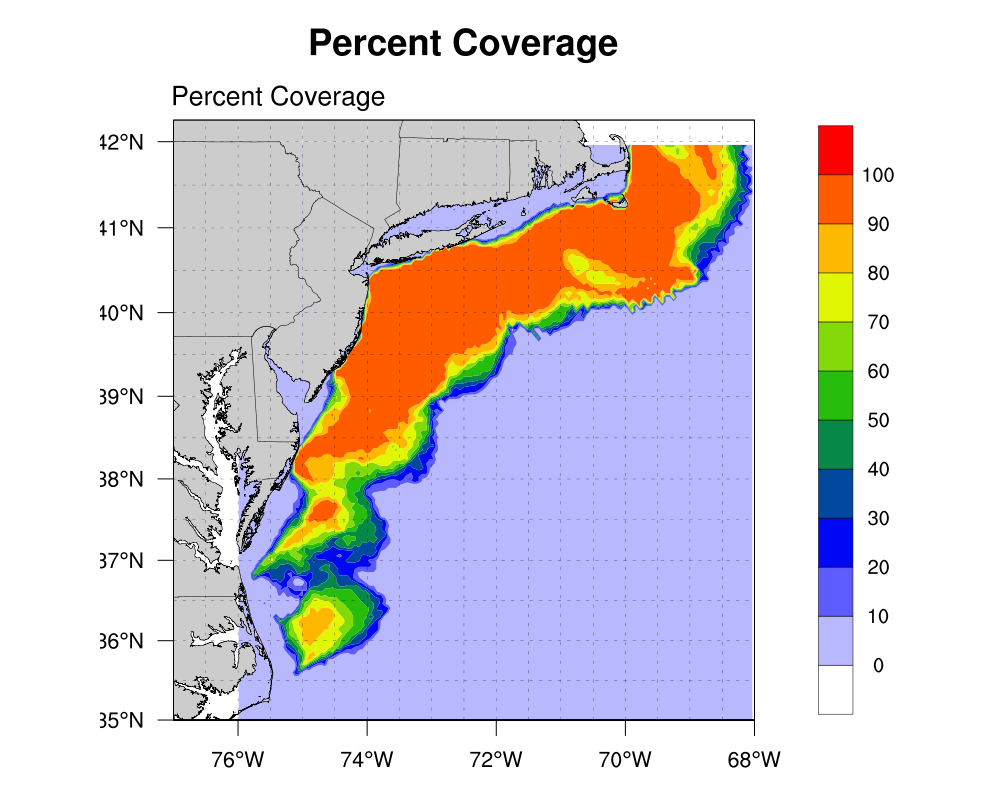
I am having difficulties trying to arrange the color bar on the
following plot. I want the plot to look like the test.Auto_levels.png
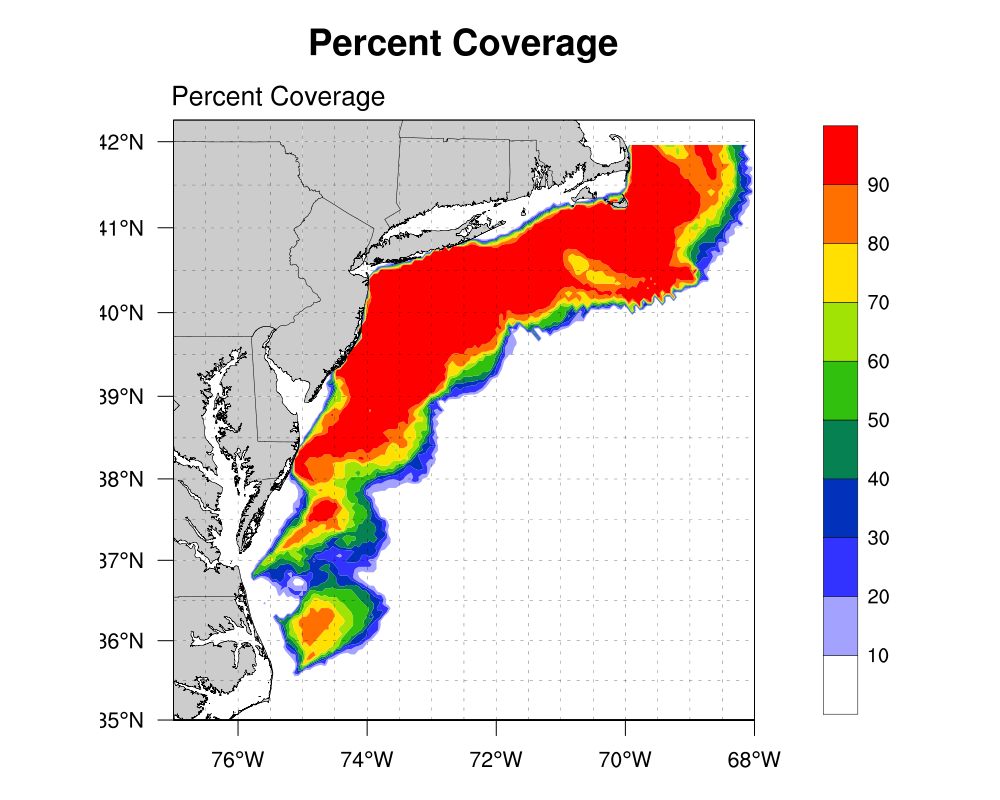
figure (see attachment), however I want to adjust the bar to start
from 0 to 100. When I set the cnLevelSlectionMode to Manual level and
select the contour spacing I get the test.Manual_levels.png (see
attachment) figure and for some reason the colors change. This is what
I have as my settings (see attach). I think I am missing something,
but I can not figure out what seems to be the problem if it is on the
label bar or with the colors. Not sure. Let me know if you have any
suggestions. Thanks.
res = True ; plot mods desired
; Contour lines settings
res@cnFillOn = True ; turn on color
res@cnLinesOn = False ; no contour lines
res@cnLevelSelectionMode = "ManualLevels" ; set manual
contour levels
res@cnMinLevelValF = 0. ; set min contour
level
res@cnMaxLevelValF = 100. ; set max
contour level
res@cnLevelSpacingF = 10. ; contour spacing
res@gsnSpreadColors = True ; use full color
map
res@gsnSpreadColorStart = 0
res@gsnSpreadColorEnd = -2 ; don't use added
gray
res@lbOrientation ="vertical" ; vertical label
bar
res@lbLabelAutoStride = True ; every
other label
; Map settings
;This will start Zooming into the MAB and creating a Mercator
Projection
res@mpProjection = "mercator" ; projection
res@mpLimitMode = "Corners" ; method to zoom
res@mpLeftCornerLatF = minLat;min(lat)
res@mpLeftCornerLonF = minLon;min(lon)
res@mpRightCornerLatF = maxLat;max(lat)
res@mpRightCornerLonF = maxLon;max(lon)
res@cnFillDrawOrder = "PreDraw" ; fill first
res@gsnAddCyclic = False;
res@mpLandFillColor = "gray"; Map fill color is gray
res@mpOutlineOn = True; Draw map outline
res@mpDataBaseVersion = "HighRes"; Medium resolution map
res@mpDataBaseVersion = "HighRes" ; use MAB High
Resolution
res@pmTickMarkDisplayMode = "Always" ; turn on tickmarks
res@mpFillDrawOrder = "Draw"
; Turn on map grid
res@mpGridAndLimbOn = True;
; Set gridline intervals
res@mpGridSpacingF = 0.5; ; 1/2 degree intervals
res@mpGridLineDashPattern = 2; ; dashed line
res@mpGridLineThicknessF = 0.5;
Cheers,
Erick Rafael Rivera Lemus
Software Technician
Institute of Marine and Coastal Sciences
Coastal Ocean Observation Laboratory
Rutgers, The State University of New Jersey
71 Dudley Road New Brunswick, NJ 08901 Phone: 732-932-6555 ext. 503
Fax: 732-932-1821
Cell: 617-447-5106
_______________________________________________
ncl-talk mailing list
List instructions, subscriber options, unsubscribe:
http://mailman.ucar.edu/mailman/listinfo/ncl-talk