Date: Wed Aug 17 2011 - 08:47:15 MDT
Dear List Members,
I have a 2D variable "rc" containing regression coefficients as:
Variable: rc
Type: double
Total Size: 1443936 bytes
180492 values
Number of Dimensions: 2
Dimensions and sizes: [lat | 356] x [lon | 507]
Coordinates:
lat: [22.17641175..51.9691461]
lon: [22.17641175..23.11934862]
Number Of Attributes: 1
_FillValue : -9999
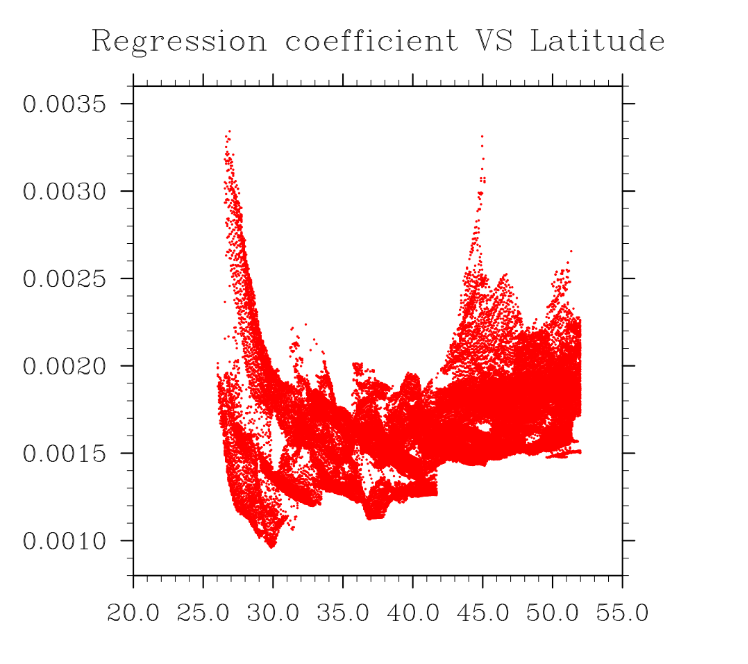
I have tried plotting it as a function of latitude but intuitively it
somehow does not seem right. I am expecting increasing values as latitude
increases and that does seem apparent in the plot but it looks like a power
spectra. My code could be right but I have sense that I am not following the
correct syntax. Please find the code reproduced below and the plot attached
- apologies if that is not the accepted method of sharing attachments, I am
new to the list.
The plotting code:
;************************************************
; plotting parameters, scatter plot of regression coefficient VS latitude
; ************************************************
wks = gsn_open_wks ("png","Regression.coefficient.VS.latitude")
; open workstation
res = True ; plot mods desired
res@tiMainString = "Regression coefficient VS Latitude" ;
add title
res@xyMonoMarkLineMode= True
res@xyMarkLineMode = "Markers" ; choose which have markers
res@xyMonoMarker = True
res@xyMarker = 16 ; choose type of marker
res@xyMarkerColor = "red" ; Marker color
res@xyMarkerSizeF = 0.002 ; Marker size (default
0.01)
res@tmLabelAutoStride = True ; nice tick mark labels
* plot = gsn_csm_xy (wks,rc&lat,rc,res) ; create plot*
Many thanks,
--
advait godbole
_______________________________________________
ncl-talk mailing list
List instructions, subscriber options, unsubscribe:
http://mailman.ucar.edu/mailman/listinfo/ncl-talk