Date: Mon Sep 05 2011 - 21:39:04 MDT
Hello, could you help me?
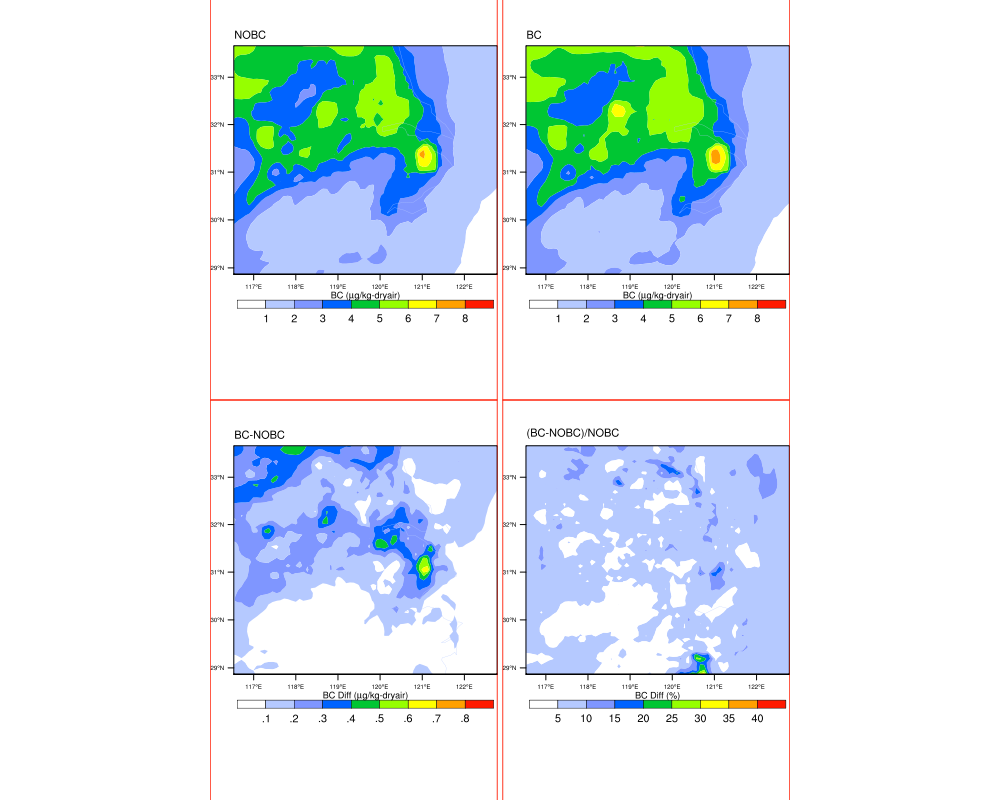
when I use "gsn_panel" for my four plots, white space in every plot exists ( please refer to attachment).
I don't know how to delete it, but it is very ugly.
In additon, in my ncl script I found that "vpWidthF" controls height, and "vpHeightF" controls weight,
so I felt very strange, why? For example, @vpWidthF=1. and @vpHeightF=.6; @vpWidthF=.6 and @vpHeightF=1.
my ncl script is as follows:
load "$NCARG_ROOT/lib/ncarg/nclscripts/csm/gsn_code.ncl"
load "$NCARG_ROOT/lib/ncarg/nclscripts/csm/gsn_csm.ncl"
load "$NCARG_ROOT/lib/ncarg/nclscripts/csm/contributed.ncl"
load "$NCARG_ROOT/lib/ncarg/nclscripts/wrf/WRFUserARW.ncl"
begin
; Read data from WRF output
fnc = addfile("$HOME/wrfout/exp175MYJ101_nobc/wrfout_d03_2009-10-14_00:00:00.nc","r")
fnd = addfile("$HOME/wrfout/exp175MYJ101_bc/wrfout_d03_2009-10-14_00:00:00.nc","r")
bc_E0 = fnc->bc_a01
bc_E1 = fnd->bc_a01
; Open graphics file
wks = gsn_open_wks("png","sfc_chem_"+varname)
gsn_define_colormap(wks,"precip3_16lev")
; Set up some basic plot resources
pltres = True
pltres@PanelPlot = True
pltres@FramePlot = False
mpres = True
mpres@mpProjection = "LambertConformal"
mpres@mpGridAndLimbOn = False
cnres = True
cnres@gsnFrame = False
cnres@gsnDraw = False
cnres@InitTime = False
cnres@Footer = False
cnres@vpWidthF = 1.
cnres@vpHeightF = 1.
cnres@cnFillOn = True
cnres@cnLinesOn = False
cnres@cnLevelSelectionMode = "ManualLevels"
cnres@lbTitleFontHeightF = .025
cnres@lbLabelFontHeightF = .030
; MAKE PLOTS
opts = cnres
opts@FieldTitle = "NOBC"
opts@lbTitleString = "BC (~F33~m~F21~g/kg-dryair)"
plot = wrf_contour(fnc,wks,dim_avg_n(bc_E0(:,0,:,:),0),opts)
sfc0 = wrf_map_overlays(fnc,wks,(/plot/),pltres,mpres)
opts@FieldTitle = "BC"
plot = wrf_contour(fnc,wks,dim_avg_n(bc_E1(:,0,:,:),0),opts)
sfc1 = wrf_map_overlays(fnc,wks,(/plot/),pltres,mpres)
delete(opts)
opts = cnres
opts@FieldTitle = "BC-NOBC"
opts@lbTitleString = "BC Diff (~F33~m~F21~g/kg-dryair)"
bcdf = bc_E1-bc_E0
plot = wrf_contour(fnc,wks,dim_avg_n(bcdf(:,0,:,:),0),opts)
sfc2 = wrf_map_overlays(fnc,wks,(/plot/),pltres,mpres)
delete(opts)
opts = cnres
opts@FieldTitle = "(BC-NOBC)/NOBC"
opts@lbTitleString = "BC Diff (%)"
bcdr = (bc_E1-bc_E0)/bc_E0*100
plot = wrf_contour(fnc,wks,dim_avg_n(bcdr(:,0,:,:),0),opts)
sfc3 = wrf_map_overlays(fnc,wks,(/plot/),pltres,mpres)
pnlres = True
pnlres@gsnPanelYWhiteSpacePercent = 0
pnlres@gsnPanelBoxes = True
gsn_panel(wks,(/sfc0,sfc1,sfc2,sfc3/),(/2,2/),pnlres)
end
Thanks for any help
_______________________________________________
ncl-talk mailing list
List instructions, subscriber options, unsubscribe:
http://mailman.ucar.edu/mailman/listinfo/ncl-talk