Date: Mon Sep 05 2011 - 07:54:58 MDT
Hi everyone! I am having problems understanding the output of the covcorm
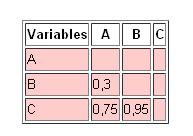
function. My output is a matrix but I don't get the entrances of it. I will
put you in a graphical way so you understand me better (see the attached image
). What's A, B and C?? I put my script too...
*
T2 = f->T2
dimT2 = dimsizes(T2)
ntim = dimT2(0)
ndom = dimT2(1)
nsta = dimT2(2)
t2 = T2(domain|:,station|:,time|:)
t2_2d = onedtond( ndtooned(t2), (/ndom*nsta, ntim/) )
dom01=t2_2d(0:11,:)
r = covcorm( dom01, (/ 1, 1/) )
print(r)
*
Thank you all!
--
*Estefanía Jiménez R.*
**Meteoróloga
Departamento de Climatología e Investigaciones Aplicadas
Instituto Meteorológico Nacional
MINAET
Tel: +506 2222 5616 ext 136
_______________________________________________
ncl-talk mailing list
List instructions, subscriber options, unsubscribe:
http://mailman.ucar.edu/mailman/listinfo/ncl-talk