Date: Thu Sep 15 2011 - 13:08:11 MDT
Hello, Adam,
I've tried that but I get an error:
(0) gsn_add_cyclic: Warning: The range of your longitude data is not 360.
(0) You may want to set gsnAddCyclic to False to avoid a warning
(0) message from the spline function.
warning:_NhlCreateSplineCoordApprox: Attempt to create spline
approximation for X axis failed: consider adjusting trXTensionF value
warning:IrTransInitialize: error creating spline approximation for
trXCoordPoints; defaulting to linear
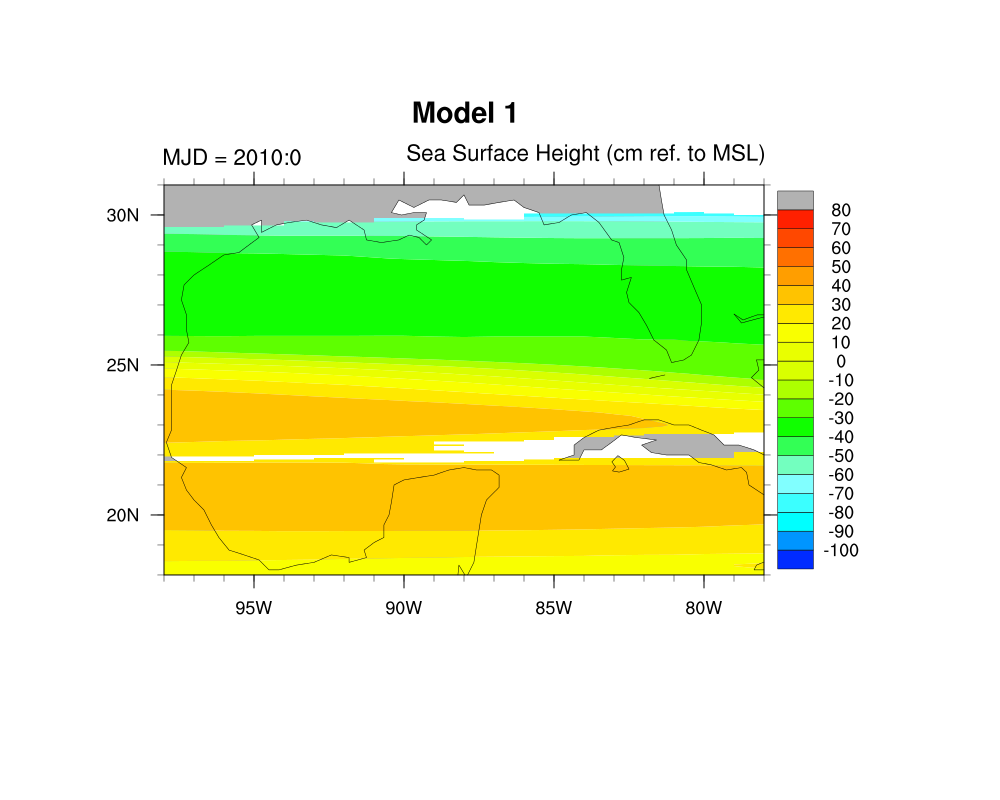
Attached is the script and a .png of the output.
ALSO, I would like to display land in gray with a black shoreline. Isn't
there an easy way to accomplish this?
Thanks, again,
gerry
On 09/15/2011 01:57 PM, Adam Phillips wrote:
> Hi Gerry,
> I see you are using gsn_csm_contour as opposed to gsn_csm_contour_map..
> (I didn't recognize this yesterday when I sent my original reply.) Are
> you doing that on purpose? If so, then you can simply set vpWidthF and
> vpHeightF to whatever values you wish between 0 and 1.
>
> If not, and you meant to use gsn_csm_contour_map, then the aspect ratio
> will depend on the map projection you are using. By default the
> projection is cylindrical equidistant. If you want to change the aspect
> ratio when using one of the gsn_csm_*_map* routines, beyond setting
> vpWidthF and vpHeightF, you also need to set mpShapeMode = "FreeAspect"
>
> Hope that helps..
> Adam
>
> On 09/15/2011 12:43 PM, Gerald Creager wrote:
>> Hit Send too fast. That did, in fact, cure the problem. Thanks for the
>> gentle reminder.
>>
>> Now, an aesthetics problem: The plot looks "squished" horizontally. Is
>> there a suggested aspect ratio I could set?
>>
>> On 09/15/2011 08:16 AM, Gerald Creager wrote:
>>> Argh... No, Adam, it doesn't:
>>>
>>> printVarSummary(model1Ssh)
>>>
>>> Variable: model1Ssh
>>> Type: float
>>> Total Size: 37677960 bytes
>>> 9419490 values
>>> Number of Dimensions: 3
>>> Dimensions and sizes: [90] x [261] x [401]
>>> Coordinates:
>>> Number Of Attributes: 1
>>> _FillValue : -9999
>>>
>>>
>>> On 09/14/2011 04:56 PM, Adam Phillips wrote:
>>>> Hi Gerry,
>>>> Does your model1Ssh array have associated latitude/longitude coordinate
>>>> variables? You can see if it does by using printVarSummary:
>>>> printVarSummary(model1Ssh)
>>>>
>>>> You should see something like this:
>>>>
>>>> Variable: model1Ssh
>>>> <snip>
>>>> Coordinates:
>>>> time: [17067072..17618592]
>>>> lat: [90..-90]
>>>> lon: [ 0..357.5]
>>>> (Last 3 lines show the coordinate variables.)
>>>>
>>>> If coordinate variables aren't present, you need to assign them.
>>>> Looking
>>>> at your script though, I see you are doing this:
>>>> model1Ssh=100 * model1->sea_surface_height_above_sea_level
>>>> This will result in only the data being passed from the right-hand side
>>>> of the equal sign to the left-hand side, and not the coordinate
>>>> variables associated with sea_surface_height_above_sea_level array.
>>>>
>>>> I'd recommend changing this:
>>>> model1Ssh=100 * model1->sea_surface_height_above_sea_level
>>>> to this:
>>>> model1Ssh=model1->sea_surface_height_above_sea_level
>>>> model1Ssh = model1Ssh*100
>>>>
>>>> I would venture to guess that that will fix your coordinate variables,
>>>> and therefore the lats/lons shown on your plot...
>>>>
>>>> As far as the land mask issue: As you are plotting SSH there is no data
>>>> over land, so those areas are getting color filled white. You need to
>>>> tell NCL to color fill the map after the contour field gets color
>>>> filled. Try setting res@mpFillDrawOrder = "PostDraw", and set
>>>> res@mpLandFillColor = "gray70", as you are adding gray70 to your
>>>> colormap, and it's best to exactly specify the color your want NCL to
>>>> use.
>>>>
>>>> Let the group know if that doesn't solve everything..
>>>> Adam
>>>>
>>>> On 09/14/2011 03:34 PM, Gerald Creager wrote:
>>>> -------- Original Message --------
>>>> Subject: Converting axis coordinates
>>>> Date: Wed, 14 Sep 2011 16:34:13 -0500
>>>> From: Gerald Creager<gerry.creager@tamu.edu>
>>>> Reply-To: gerry.creager@tamu.edu
>>>> Organization: AATLT, Texas A&M University
>>>> To: ncl-talk@ucar.edu<ncl-talk@ucar.edu>
>>>>
>>>> I'm creating an image of a model output (attached), and the X and Y
>>>> coordinates are currently in model indices. I'd like to have them
>>>> represented as Lon/Lat.
>>>>
>>>> Also, I tried to create a gray landmask but it didn't seem to work. If
>>>> someone's got a suggestion for that, I'd appreciate it. The ncl script
>>>> is also attached.
>>>>
>>>> Thanks, gerry
>>>
>>
>
--
Gerry Creager -- gerry.creager@tamu.edu
Texas Mesonet -- AATLT, Texas A&M University
Cell: 979.229.5301 Office: 979.458.4020 FAX: 979.862.3983
Office: 1700 Research Parkway Ste 160, TAMU, College Station, TX 77843
_______________________________________________
ncl-talk mailing list
List instructions, subscriber options, unsubscribe:
http://mailman.ucar.edu/mailman/listinfo/ncl-talk
- text/plain attachment: Step23-Model1.ncl