Date: Wed Nov 23 2011 - 11:55:30 MST
Hi users,
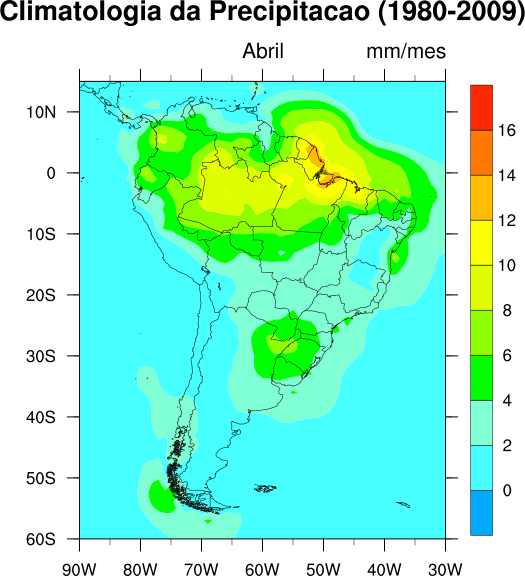
How I do to plot only values above 1 (mm/mes). My variable is
precipitation. My script is attach.
[image: PRR_ABR.png]
Thanks,
Guilherme.
--
Guilherme Martins
Homepage: http://guilhermemartins.hd1.com.br/
_______________________________________________
ncl-talk mailing list
List instructions, subscriber options, unsubscribe:
http://mailman.ucar.edu/mailman/listinfo/ncl-talk
- application/octet-stream attachment: clima.prp.ncl