Please read the documentation of the vector
resources that you set.
eg
vcres@vcMinDistanceF = 0.030
vcres@vcMinMagnitudeF = 20.0
vcres@vcMaxMagnitudeF = 150.0
vcMinMagnitudeF
This resource specifies a minimum magnitude for elements of the
vector field. Vectors with magnitudes less than this value will not be
rendered in the vector field plot.
Default: 0.0
===
vcMinDistanceF
This resource specifies a minimum distance in NDC space that is to
separate the data locations of neighboring vectors. Vectors are
elimininated from the plot until there are no vectors closer than the
specified distance. Note that if the realized length of a vector glyph
is long enough, it is still possible that it may overlap neighboring
glyphs. However, the grid point locations are guaranteed to be no closer
than the distance specified. When this resource has its default value,
0.0, the thinning algorithm is not applied.
Default: 0.0
On 11/24/11 12:36 PM, ugo merlini wrote:
> Hi
>
> here a better link to the plot
>
> http://s103.photobucket.com/albums/m136/ugo73/?action=view¤t=Vento_file_temporaneo000001.png
>
> ------------------------------------------------------------------------
> From: ugomerlini@hotmail.com
> To: ncl-talk@ucar.edu
> Date: Thu, 24 Nov 2011 19:32:36 +0000
> Subject: Prblems with wind speed plot
>
> Hi,
>
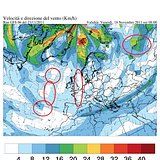
> I spent two wreeks on how solved the problem on contouring wind speed
> and as can be see in some point the color disapprear stranggly (the one
> in the red circle for example
>
> [URL=http://s103.photobucket.com/albums/m136/ugo73/?action=view¤t=Vento_file_temporaneo000001.png][IMG]http://i103.photobucket.com/albums/m136/ugo73/th_Vento_file_temporaneo000001.png[/IMG][/URL]
>
>
> here the code
>
>
> ;----------------------------------------------------------------------
> ; This example shows how to read geographic data
> ; from Natural Earth shapefiles
> ; and plot them as polylines and polygons.
> ;----------------------------------------------------------------------
> ; This particular example plots data for Switzerland.
> ;----------------------------------------------------------------------
> ; Download the shapefiles from http://www.naturalearthdata.com/
> ; Unzip to a directory
> ;----------------------------------------------------------------------
>
> load "$NCARG_ROOT/lib/ncarg/nclscripts/csm/gsn_code.ncl"
> load "$NCARG_ROOT/lib/ncarg/nclscripts/csm/gsn_csm.ncl"
> load "$NCARG_ROOT/lib/ncarg/nclscripts/csm/contributed.ncl"
> load "$NCARG_ROOT/lib/ncarg/nclscripts/csm/shea_util.ncl"
> load "$NCARG_ROOT/lib/ncarg/nclscripts/contrib/calendar_decode2.ncl"
> load "$NCARG_ROOT/lib/ncarg/nclscripts/contrib/ut_string.ncl"
>
>
> ;****************************
> ; Funzioni personalizzate *
> ;****************************
>
> ; funzione Data validità
>
> undef("Nuova_data")
> function Nuova_data(data:string)
> local anno, mese, giorno, ora, formato_data, data, data_intermedia_1,
> data_intermedia_2, data_intermedia_3, data_intermedia_4,
> data_intermedia_5, data_intermedia_6
>
> begin
>
> anno = stringtointeger( str_get_cols( data, 0, 3) )
> mese = stringtointeger( str_get_cols( data, 4, 5) )
> giorno = stringtointeger( str_get_cols( data, 6, 7) )
> ora = stringtointeger( str_get_cols( data, 8, 9) )
> formato_data = "hours since 1800-01-01 00:00:00"
>
> data_intermedia_1 = cd_inv_calendar( anno, mese, giorno, ora, 0, 0,
> formato_data, 0 )
>
> ; since data_intermedia_1 has the units "hours since ..." the 2 here
> adds 2 hours
> data_intermedia_2 = data_intermedia_1 + 2
> data_intermedia_2@units = formato_data
>
>
> data_intermedia_3 = cd_calendar( data_intermedia_2, -3 )
>
>
> data_intermedia_4 = sprinti ( "%0.8i", data_intermedia_3 )
>
> ymd2String=str_get_cols ( data_intermedia_4, 0, 7 )
> hr2String =str_get_cols ( data_intermedia_4, 8, 9 )
>
> data_intermedia_5 = systemfunc( "date -d '"+ymd2String+" "+hr2String+"'
> '+%A, %d %B %Y ore %H:00'" )
>
> if isStrSubset(data_intermedia_5,"gennaio") then
> data_intermedia_6 = str_sub_str(data_intermedia_5,"gennaio","Gennaio")
> end if
> if isStrSubset(data_intermedia_5,"febbraio") then
> data_intermedia_6 = str_sub_str(data_intermedia_5,"febbraio","Febbraio")
> end if
> if isStrSubset(data_intermedia_5,"marzo") then
> data_intermedia_6 = str_sub_str(data_intermedia_5,"marzo","Marzo")
> end if
> if isStrSubset(data_intermedia_5,"aprile") then
> data_intermedia_6 = str_sub_str(data_intermedia_5,"aprile","Aprile")
> end if
> if isStrSubset(data_intermedia_5,"maggio") then
> data_intermedia_6 = str_sub_str(data_intermedia_5,"maggio","Maggio")
> end if
> if isStrSubset(data_intermedia_5,"giugno") then
> data_intermedia_6 = str_sub_str(data_intermedia_5,"giugno","Giugno")
> end if
> if isStrSubset(data_intermedia_5,"luglio") then
> data_intermedia_6 = str_sub_str(data_intermedia_5,"luglio","Luglio")
> end if
> if isStrSubset(data_intermedia_5,"agosto") then
> data_intermedia_6 = str_sub_str(data_intermedia_5,"agosto","Agosto")
> end if
> if isStrSubset(data_intermedia_5,"settembre") then
> data_intermedia_6 = str_sub_str(data_intermedia_5,"settembre","Settembre")
> end if
> if isStrSubset(data_intermedia_5,"ottobre") then
> data_intermedia_6 = str_sub_str(data_intermedia_5,"ottobre","Ottobre")
> end if
> if isStrSubset(data_intermedia_5,"novembre") then
> data_intermedia_6 = str_sub_str(data_intermedia_5,"novembre","Novembre")
> end if
> if isStrSubset(data_intermedia_5,"dicembre") then
> data_intermedia_6 = str_sub_str(data_intermedia_5,"dicembre","Dicembre")
> end if
>
> if ((str_get_cols( data_intermedia_6, 0, 6) ).eq.("lunedì")) then
> nuova_data = "Lunedi~H-10V2F35~A~FV-2H3~" + str_get_cols(
> data_intermedia_6, 7, strlen(data_intermedia_6)-1 )
> end if
> if ((str_get_cols( data_intermedia_6, 0, 7) ).eq.("martedì")) then
> nuova_data = "Martedi~H-10V2F35~A~FV-2H3~" + str_get_cols(
> data_intermedia_6, 8, strlen(data_intermedia_6)-1 )
> end if
> if ((str_get_cols( data_intermedia_6, 0, 9) ).eq.("mercoledì")) then
> nuova_data = "Mercoledi~H-10V2F35~A~FV-2H3~" + str_get_cols(
> data_intermedia_6, 10, strlen(data_intermedia_6)-1 )
> end if
> if ((str_get_cols( data_intermedia_6, 0, 7) ).eq.("giovedì")) then
> nuova_data = "Giovedi~H-10V2F35~A~FV-2H3~" + str_get_cols(
> data_intermedia_6, 8, strlen(data_intermedia_6)-1 )
> end if
> if ((str_get_cols( data_intermedia_6, 0, 7) ).eq.("venerdì")) then
> nuova_data = "Venerdi~H-10V2F35~A~FV-2H3~" + str_get_cols(
> data_intermedia_6, 8, strlen(data_intermedia_6)-1 )
> end if
> if ((str_get_cols( data_intermedia_6, 0, 5) ).eq.("sabato")) then
> nuova_data = "Sabato" + str_get_cols( data_intermedia_6, 6,
> strlen(data_intermedia_6)-1 )
> end if
> if ((str_get_cols( data_intermedia_6, 0, 7) ).eq.("domenica")) then
> nuova_data = "Domenica" + str_get_cols( data_intermedia_6, 8,
> strlen(data_intermedia_6)-1 )
> end if
>
>
> return (nuova_data)
>
> end
>
>
> ;**********************
> ; Codice principale *
> ;**********************
>
> begin
>
>
> ;*****************************************
> ; Open workstation and define colormap *
> ;*****************************************
>
> wks_type = "png" ; use "newpdf" instead of "pdf" for smaller files
> wks_type@wkWidth = 1024
> wks_type@wkHeight = 1024
> wks = gsn_open_wks(wks_type,"Vento_file_temporaneo")
> gsn_define_colormap(wks,"ugo") ; choose colormap
>
>
> ;******************
> ; read gfs data *
> ;******************
>
> systemdate = systemfunc("date +%H%M")
>
> if ((systemdate.eq."0645"))then
> url = "http://nomads.ncep.noaa.gov:9090/dods/gfs_hd/gfs_hd" +
> systemfunc("date +%Y%m%d") + "/"
> filename = url + "gfs_hd_00z"
> run = "Run GFS 00 del " + systemfunc("date +%d/%m/%Y")
> run_nome_file = "Run_GFS_00Z"
> end if
> if ((systemdate.eq."1245")) then
> url = "http://nomads.ncep.noaa.gov:9090/dods/gfs_hd/gfs_hd" +
> systemfunc("date +%Y%m%d") + "/"
> filename = url + "gfs_hd_06z"
> run = "Run GFS 06 del " + systemfunc("date +%d/%m/%Y")
> run_nome_file = "Run_GFS_06Z"
> end if
> if ((systemdate.eq."1845")) then
> url = "http://nomads.ncep.noaa.gov:9090/dods/gfs_hd/gfs_hd" +
> systemfunc("date +%Y%m%d") + "/"
> filename = url + "gfs_hd_12z"
> run = "Run GFS 12 del " + systemfunc("date +%d/%m/%Y")
> run_nome_file = "Run_GFS_12Z"
> end if
> if ((systemdate.eq."0045")) then
> url = "http://nomads.ncep.noaa.gov:9090/dods/gfs_hd/gfs_hd" +
> systemfunc("date -d '-1 day' +'%Y%m%d'") + "/"
> filename = url + "gfs_hd_18z"
> run = "Run GFS 18 del " + systemfunc("date -d '-1 day' +'%d/%m/&Y'")
> run_nome_file = "Run_GFS_18Z"
> end if
>
> url = "http://nomads.ncep.noaa.gov:9090/dods/gfs_hd/gfs_hd20111118/"
> filename = url + "gfs_hd_06z"
> run = "Run GFS 06 del " + systemfunc("date +%d/%m/%Y")
> run_nome_file = "Run_GFS_00Z"
>
> exists = isfilepresent(filename)
> if(.not.exists) then
> print("OPeNDAP isfilepresent test unsuccessful.")
> print("Either file doesn't exist, or NCL does not have OPeNDAP
> capabilities on this system")
> else
> print("OPeNDAP isfilepresent test successful.")
> gfs = addfile(filename,"r")
> vars = getfilevarnames(gfs)
> end if
>
>
> ;*********************************
> ; risorse per la mappa di base *
> ;*********************************
>
> mappa = True
> mappa@mpProjection = "LambertConformal" ; proiezione mappa
>
> mappa@gsnMaximize = True ; massimizza la grafica in base alle dimensioni
> del foglio
> mappa@gsnDraw = False ; la grafica non viene disegnata in automatico
> mappa@gsnFrame = False ; il frame non avanza in automatico
>
> mappa@mpLimitMode = "LatLon" ; tipo di limite della mappa
> mappa@mpMinLonF = -43.0 ; estremo est della mappa
> mappa@mpMaxLonF = 47.0 ; estremo ovest della mappa
> mappa@mpMaxLatF = 88.5 ; estremo nord della mappa
> mappa@mpMinLatF = 27.0 ; estremo sud della mappa
>
> mappa@mpGridAndLimbOn = True ; disegna i meridiani e i paralleli sulla mappa
> mappa@mpGridLineDashPattern = 10 ; tipo di linea utilizzata per
> disegnare i meridiani e i paralleli sulla mappa
>
>
> ;******************************
> ; risorse generali dei plot *
> ;******************************
>
> plot_generale= True
> plot_generale@gsnMaximize = True ; massimizza la grafica in base alle
> dimensioni del foglio
> plot_generale@gsnDraw = False ; la grafica non viene disegnata in automatico
> plot_generale@gsnFrame = False ; il frame non avanza in automatico
> plot_generale@gsnAddCyclic = True
> plot_generale@gsnSpreadColors = False ; prendo possesso della colormap
> in modo da personalizzare i colori con i valori delle singole mappe
> plot_generale@gsnRightString = "" ; elimino il testo standard scritto in
> alto a destra
> plot_generale@gsnLeftString = "" ; elimino il testo standard scritto in
> alto a sinistra
>
>
> ;*******************************
> ; risorse generali dei testi *
> ;*******************************
>
> testo_generale = True
> testo_generale@txFont = "times-roman" ; stalisco il carattere da
> utilizzare nei testi
> testo_generale@txBackgroundFillColor = "Transparent" ; stalisco il
> colore di sfondo del testo
>
> testo_titolo = testo_generale
> testo_titolo@txFontHeightF = 0.02 ; stabilisco la grandezza del testo
> relativo al titolo
> testo_titolo@txJust = "CenterLeft" ; stabilisco la giustificazione del
> testo relativo al titolo
> testo_titolo@txPosXF = 0.02 ; stabilisco la partenza sulla griglia
> orizontale del testo relativo al titolo
> testo_titolo@txPosYF = 0.885 ; stabilisco la partenza sulla griglia
> verticale del testo relativo al titolo
>
> testo_modello = testo_generale
> testo_modello@txFontHeightF = 0.015 ; stabilisco la grandezza del testo
> relativo al nome del modello
> testo_modello@txJust = "BottomLeft" ; stabilisco la giustificazione del
> testo relativo al nome del modello
> testo_modello@txPosXF = 0.02 ; stabilisco la partenza sulla griglia
> orizontale del testo relativo al nome del modello
> testo_modello@txPosYF = 0.851 ; stabilisco la partenza sulla griglia
> verticale del testo relativo al nome del modello
>
> testo_data = testo_generale
> testo_data@txFontHeightF = 0.015 ; stabilisco la grandezza del testo
> relativo al periodo di riferimento
> testo_data@txJust = "BottomRight" ; stabilisco la giustificazione del
> testo relativo al periodo di riferimento
> testo_data@txPosXF = 0.98 ; stabilisco la partenza sulla griglia
> orizontale del testo relativo al periodo di riferimento
> testo_data@txPosYF = 0.85 ; stabilisco la partenza sulla griglia
> verticale del testo relativo al periodo di riferimento
>
>
> ;******************************
> ; generazione mappa di base *
> ;******************************
>
> map = gsn_csm_map(wks,mappa)
>
> fnames = "/mnt/internetserver/map/shapefile/europa/aaa_full/" +
> (/"europa"/) + ".shp" ; Files to be open
> linecolors = (/"Black"/) ; color definition for each shapefile
> fillcolors = (/"Transparent"/) ; Fill color definition for each shapefile
> thicks = (/2/) ; Thickness for each shapefile
> lnres = True ; resources for polylines
> plres = True
> prims = True
> lines = True
> do n=0,dimsizes(fnames)-1 ; Loop through files that we want to read
> geographic information from.
> f = addfile(fnames(n),"r") ; Open the shapefile number n.
> segments = f->segments ; Read data off the shapefile
> geometry = f->geometry
> segsDims = dimsizes(segments)
> geomDims = dimsizes(geometry)
> geom_segIndex = f@geom_segIndex ; Read global attributes
> geom_numSegs = f@geom_numSegs
> segs_xyzIndex = f@segs_xyzIndex
> segs_numPnts = f@segs_numPnts
> geometry_type = f@geometry_type
> numFeatures = geomDims(0)
> lon = f->x
> lat = f->y
> if (geometry_type.eq."polygon") then ; Put if statement outside the loop
> plres@gsFillColor = fillcolors(n)
> plres@gsEdgesOn = True ; Draw border around polygons
> plres@gsEdgeColor = linecolors(n)
> plres@gsEdgeThicknessF = thicks(n)
> do i=0, numFeatures-1 ; Section to draw polygons on map.
> startSegment = geometry(i, geom_segIndex)
> numSegments = geometry(i, geom_numSegs)
> do seg=startSegment, startSegment+numSegments-1
> startPT = segments(seg, segs_xyzIndex)
> endPT = startPT + segments(seg, segs_numPnts) - 1
> dumstr = unique_string("lines") ; This call adds the polygon.
> map@$dumstr$ = gsn_add_polygon(wks, map , lon(startPT:endPT),
> lat(startPT:endPT), plres)
> end do
> end do
> else
> lnres@gsLineThicknessF = thicks(n)
> lnres@gsLineColor = linecolors(n)
> do i=0, numFeatures-1 ; Section to draw polylines on map.
> startSegment = geometry(i, geom_segIndex)
> numSegments = geometry(i, geom_numSegs)
> do seg=startSegment, startSegment+numSegments-1
> startPT = segments(seg, segs_xyzIndex)
> endPT = startPT + segments(seg, segs_numPnts) - 1
> dumstr = unique_string("primitive") ; This call adds the line segment.
> map@$dumstr$ = gsn_add_polyline(wks, map, lon(startPT:endPT),
> lat(startPT:endPT), lnres)
> end do
> end do
> end if
> delete(lat) ; Clean up before we read in same variables again.
> delete(lon)
> delete(segments)
> delete(geometry)
> delete(segsDims)
> delete(geomDims)
> end do
>
>
> ;**********
> ; Vento *
> ;**********
>
> ; Risorse
>
> vento_velocita = plot_generale
>
> ;vento_velocita@cnLevelSelectionMode = "ExplicitLevels" ; set how manage
> contour line levels
> ;vento_velocita@cnLevels =
> (/19,100,105,110,115,120,125,130,135,140,145,150,155,160,165,170,175,180,185,190,195,200/)
> ;vento_velocita@cnLevelFlags =
> (/"Noline","LineOnly","Noline","LineOnly","Noline","LineOnly","Noline","LineOnly","Noline","LineOnly","Noline","LineOnly","Noline","LineOnly","Noline","LineOnly","Noline","LineOnly","Noline","LineOnly","Noline","LineOnly","Noline","LineOnly","Noline","LineOnly","Noline","LineOnly","Noline","LineOnly","Noline","LineOnly","Noline","LineOnly","Noline","LineOnly","Noline","LineOnly"/)
>
> vento_velocita@cnFillOn = True ; turn on color
> ;vento_velocita@cnFillColors =
> (/256,100,105,110,115,120,125,130,135,140,145,150,155,160,165,170,175,180,185,190,195,200/)
> ;vento_velocita@cnMissingValFillColor="White"
> vento_velocita@gsnSpreadColors = True
>
>
> vcres = plot_generale ; plot mods desired
>
> vcres@vcGlyphStyle = "CurlyVector" ; turn on curley vectors
>
>
>
>
>
>
> vcres@vcMinDistanceF = 0.030
> vcres@vcMinMagnitudeF = 20.0
> vcres@vcMaxMagnitudeF = 150.0
> vcres@vcRefLengthF = 0.020 ; define length of vec ref
> vcres@vcMinFracLengthF = 1.0
> vcres@vcLineArrowThicknessF = 1.0 ; change vector thickness
> vcres@vcLineArrowHeadMinSizeF = 0.005
> vcres@vcLineArrowHeadMaxSizeF = 0.005
> vcres@vcRefAnnoOn = False
>
>
>
>
>
>
>
>
> NTIMES = dimsizes(gfs->time) ; number of times in the file
> U = gfs->ugrdprs(:,7,:,:)
> V = gfs->vgrdprs(:,7,:,:)
> U_DIREZIONE_VENTO = U * 3.6
> V_DIREZIONE_VENTO = V * 3.6
> ;U_VELOCITA_VENTO = where(U.eq.0.0,U@_FillValue, U)
> ;V_VELOCITA_VENTO = where(V.eq.0.0,V@_FillValue, V)
> ;printVarSummary(gfs->ugrdprs)
>
> ;VELOCITA_VENTO =
> round(((V_VELOCITA_VENTO)/sin(atan2((V_VELOCITA_VENTO),
> U_VELOCITA_VENTO)))*3.6,3)
> ;VELOCITA_VENTO = ((V_VELOCITA_VENTO)/sin(atan2((V_VELOCITA_VENTO),
> U_VELOCITA_VENTO)))*3.6
> VELOCITA_VENTO = sqrt(U^2+V^2)
> do periodo = 0,NTIMES-1 ;NTIMES-1
> testo_titolo_plot = gsn_create_text(wks,"Velocita~H-13V2F35~A~FV-2H3~ e
> direzione del vento (Km/h)",testo_titolo)
> draw(testo_titolo_plot)
> testo_modello_plot = gsn_create_text(wks,(run),testo_modello)
> draw(testo_modello_plot)
> testo_data_plot = gsn_create_text(wks, "Validita~H-13V2F35~A~FV-2H3~: "
> +(Nuova_data(ut_string(gfs->time(periodo),"%Y%N%D%H"))),testo_data)
> draw(testo_data_plot) ; Draw text box.
>
> vento_velocita_plot =
> gsn_csm_contour(wks,VELOCITA_VENTO(periodo,:,:),vento_velocita)
> overlay(map,vento_velocita_plot)
> draw(map)
> vento_direzione_plot =
> gsn_csm_vector(wks,U_DIREZIONE_VENTO(periodo,:,:),V_DIREZIONE_VENTO(periodo,:,:),vcres)
> overlay(map,vento_direzione_plot)
> draw(map)
> destroy(vento_velocita_plot)
> destroy(vento_direzione_plot)
>
> frame(wks)
> end do
> do it = 0,NTIMES-1 ;NTIMES-1
>
>
> if (it.le.8) then
> system("mv Vento_file_temporaneo.00000" + (it+1) + ".png" + "
> Vento_file_temporaneo0" + (it) + "_" + (run_nome_file) + ".png")
> end if
> if (it.eq.9) then
> system("mv Vento_file_temporaneo.0000" + (it+1) + ".png" + "
> Vento_file_temporaneo0" + (it) + "_" + (run_nome_file) + ".png")
> end if
> if (it.ge.10) then
> system("mv Vento_file_temporaneo.0000" + (it+1) + ".png" + "
> Vento_file_temporaneo" + (it) + "_" + (run_nome_file) + ".png")
> end if
> end do
> end
>
> any hint on how solve it?
>
> Regards
>
> Ugo
>
> _______________________________________________ ncl-talk mailing list
> List instructions, subscriber options, unsubscribe:
> http://mailman.ucar.edu/mailman/listinfo/ncl-talk
>
>
> _______________________________________________
> ncl-talk mailing list
> List instructions, subscriber options, unsubscribe:
> http://mailman.ucar.edu/mailman/listinfo/ncl-talk
_______________________________________________
ncl-talk mailing list
List instructions, subscriber options, unsubscribe:
http://mailman.ucar.edu/mailman/listinfo/ncl-talk
Received on Fri Nov 25 07:49:41 2011
This archive was generated by hypermail 2.1.8 : Wed Nov 30 2011 - 19:52:47 MST