Date: Thu Dec 15 2011 - 19:42:27 MST
Hi, dear NCL users,
I get some problem about contour plot.
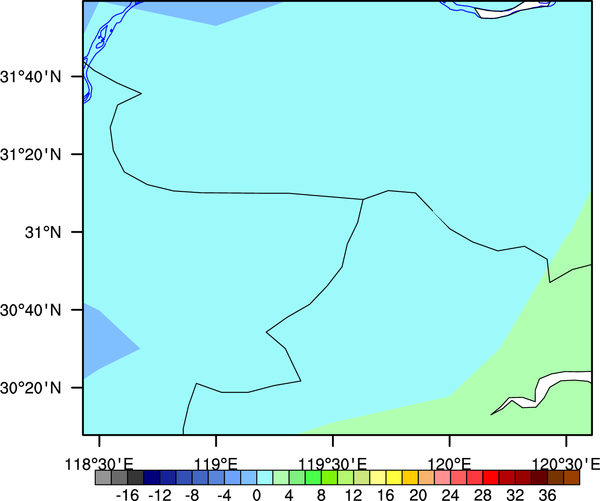
You can see the tmp1 file attached, this is what the data (say a 20*20 array )actually like.
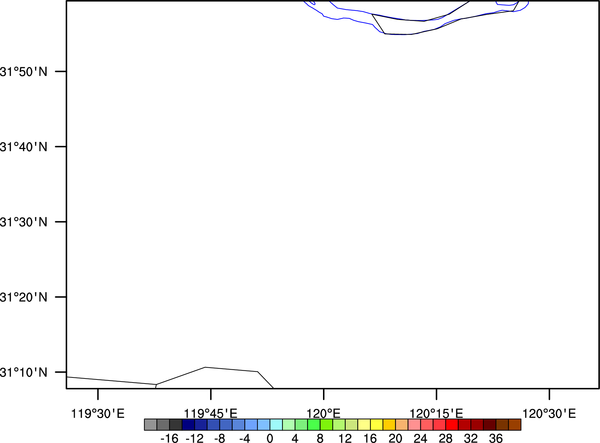
But when I reduce the map area, without reducing the data size (still 20*20), the output (tmp2) is all white.
It seems like in the small area, values are constant. Maybe this is how the white comes.
Is there any way to solve this?
Best regards
Liu
_______________________________________________
ncl-talk mailing list
List instructions, subscriber options, unsubscribe:
http://mailman.ucar.edu/mailman/listinfo/ncl-talk