Date: Thu Mar 08 2012 - 07:47:25 MST
hi
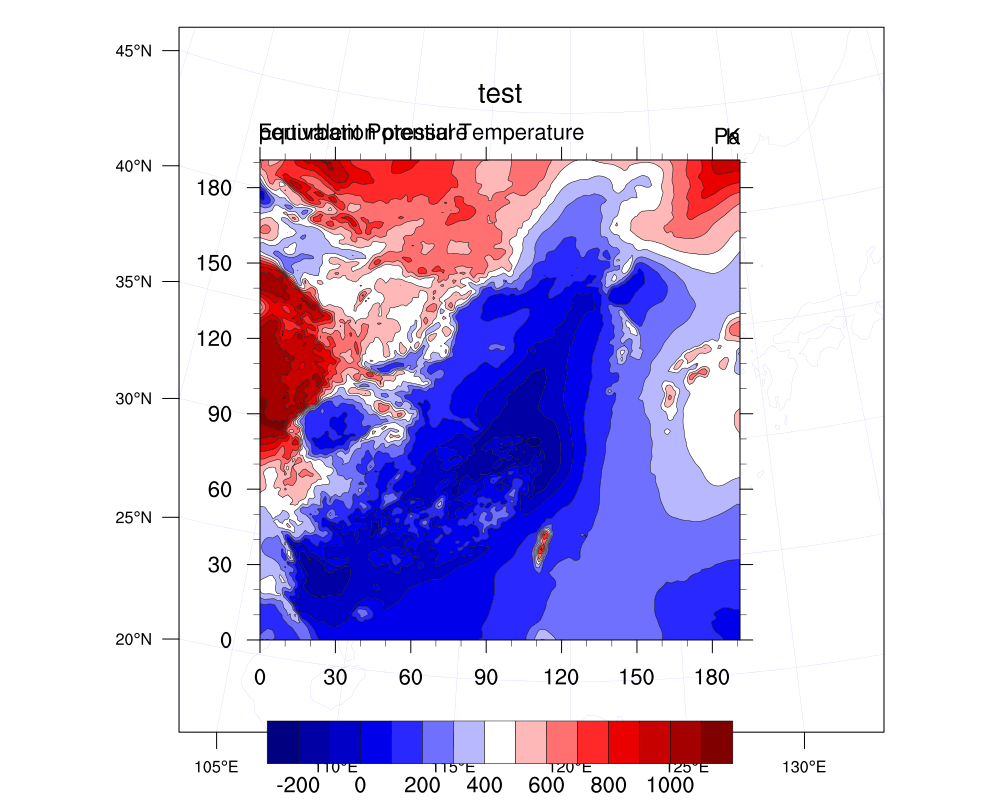
I am trying to plot some figures where there are two plots in one slide.
1
Seeing .
res=True
res@cnFillOn = True ; turn on color
res1=True
res@cnFillOn = False
plot1_S = gsn_csm_contour(plot1_wks,PP(itimes,12,:,:),res) ;Shaded
plot
plot1_C = gsn_csm_contour(plot1_wks,THE(itimes,12,:,:),res1)
;contour line plot
overlay(plot1_S,plot1_C)
draw(plot1_wks)
frame(plot1_wks)
But it seems something wrong as seeing the attachment png file .
And the data is read and calculted from a wrfout file .Can I overlay the
map of the wrf file?
--
_______________________________________________
ncl-talk mailing list
List instructions, subscriber options, unsubscribe:
http://mailman.ucar.edu/mailman/listinfo/ncl-talk