Date: Thu Aug 09 2012 - 19:29:26 MDT
Hi. I'm usually pretty good at making panel plots but I am stumped here.
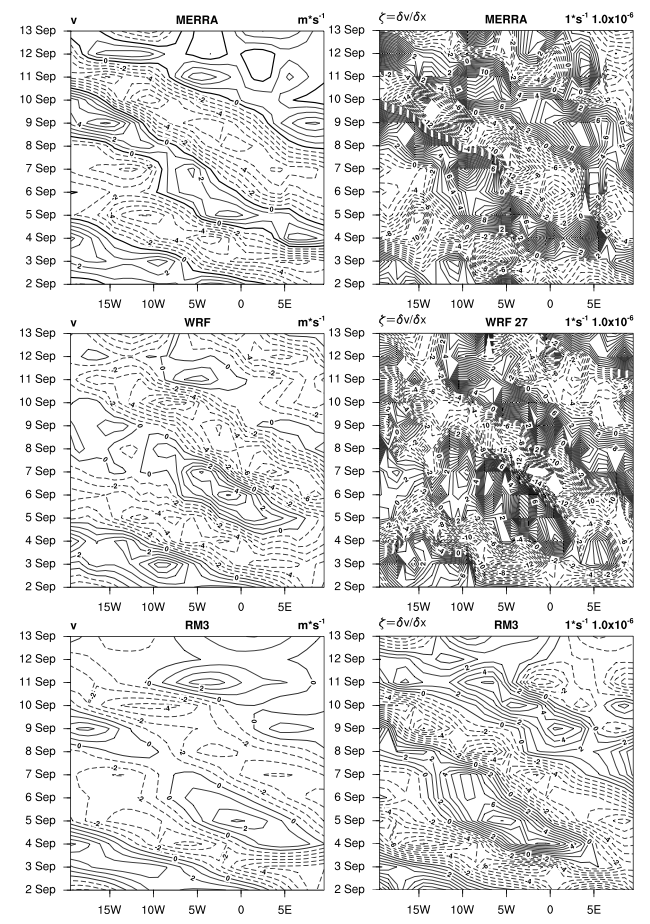
I am trying to make a panel plot of this example, here
http://www.ncl.ucar.edu/Applications/Scripts/time_labels_2.ncl.
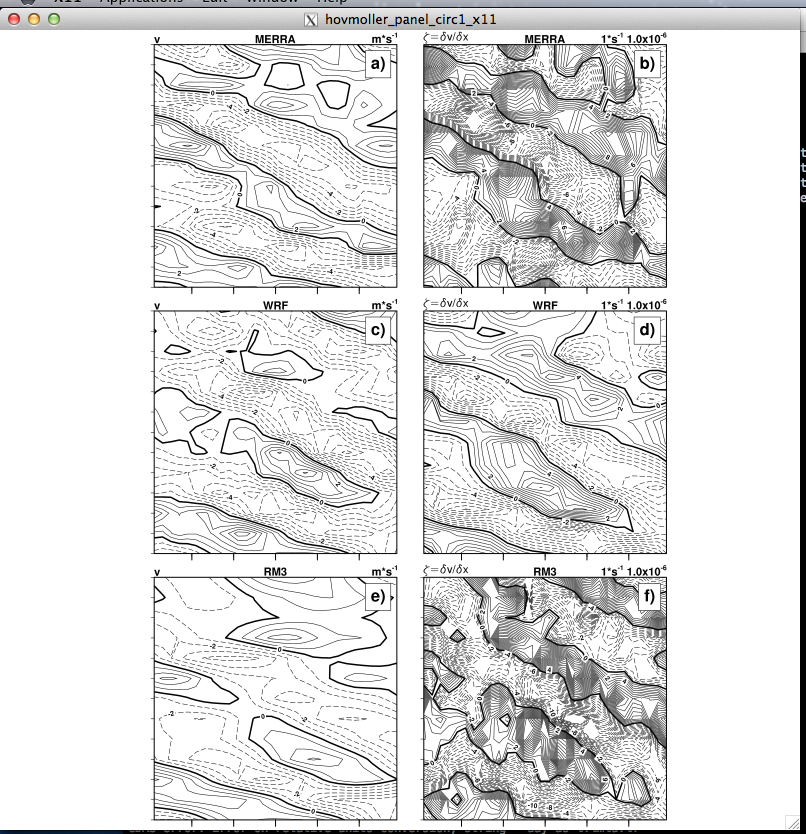
I have no problem making an individual plot, but when I try to make a panel
plot, i cannot "compress" the y-axis.
In fact, the time axis disappears, as shown
in ncl_panel_panel_plot-Not_Good.png.
The only way I can make a panel plot is by putting individual plots into
Microsoft Word or powerpoint. It's ok, but I wish it could be better.
(panel_plot_using word.png)
my code is below. I cannot find the bug because I am not getting any errors.
Thank you ahead of time if you take a look.
;*********************************************
load "$NCARG_ROOT/lib/ncarg/nclscripts/csm/gsn_code.ncl"
load "$NCARG_ROOT/lib/ncarg/nclscripts/csm/gsn_csm.ncl"
load "$NCARG_ROOT/lib/ncarg/nclscripts/csm/contributed.ncl"
load "$NCARG_ROOT/lib/ncarg/nclscripts/contrib/time_axis_labels.ncl"
;begin
;***********************************************
; Begin Users Input
;***********************************************
f1 = "hov_v7_MERRA.nc"
f2 = "hov_v7_WRF27.nc"
f3 = "hov_v7_rm3.nc"
f4 = "hov_dVoverdX_MERRA.nc"
f5 = "hov_dVoverdX_WRF27.nc"
f6 = "hov_dVoverdX_rm3.nc"
varname1 = "~F22~v"
varname2 = "~F8~z=~F8~d~F21~v/~F8~d~F21~x"
vunits1 = "~F22~ m*s~S~-1"
units2 = "1*s~S~-1~N~ 1.0x10~S~-6"
IMAGETITLE = "hovmoller_panel_circ1"
;**************************************************************
; Format of output file
;***************************************************************
type = "x11"
;type = "pdf"; "eps"; "ps"; "png";
;***********************************************
; End Users Input
;***********************************************
;******** Get files
a = addfile(f1+".nc","r")
b = addfile(f2+".nc","r")
c = addfile(f3+".nc","r")
d = addfile(f4+".nc","r")
f = addfile(f5+".nc","r")
e = addfile(f6+".nc","r")
;******** Get Variables
merrav = a->V
wrfv = b->V
rm3v = c->V
merraVort = d->dVoverdX
wrfVort = e->dVoverdX
rm3Vort = f->dVoverdX
printVarSummary(wrfv)
printVarSummary(wrfVort)
;**********************************
; Make Plot
;**********************************
plotname = IMAGETITLE;+all_files(i)
wks = gsn_open_wks(type,plotname)
res = True
res@gsnDraw = False ; don't draw
res@gsnFrame = False ; don't advance frame
res@cnInfoLabelOn = False ; turn off cn info label
;res@gsnMaximize = True ; maximize plot in frame
; Black and White
res@gsnContourZeroLineThicknessF = 3 ; thickness of zero contour (Default =
1)
res@gsnContourNegLineDashPattern = 1 ; sets negative contours to dash
pattern
res@cnInfoLabelOn = False ; turn off cn info label
;---Color
; res@cnFillOn = True
; res@cnMonoFillColor = False
; res@cnLineLabelsOn = False
; res@cnInfoLabelOn = False
; res@cnLinesOn = False
; res@gsnSpreadColors = True
; res@gsnSpreadColorStart = 21
; res@gsnSpreadColorEnd = 13
res@cnLevelSelectionMode = "ManualLevels" ; set manual contour levels
res@cnMinLevelValF = -20
res@cnMaxLevelValF = 20
res@cnLevelSpacingF = 1
; Set special resources for the time axis
resTick = True
resTick@ttmFormat = "%d %c"
resTick@ttmAxis = "YL"
resTick@ttmMajorStride = 1
; Set resources necessary to customize Y axis labels
time_axis_labels( merrav&time, res, resTick )
time_axis_labels( wrfv&time, res, resTick )
time_axis_labels( rm3v&time, res, resTick )
res@tmYROn = False ; right tickmarks
;res@tmYLOn = False ; Left tickmarks
;res@tmYLLabelsOn = False
;res@trYReverse = True
; Set resources necessary to customize X axis labels
res@gsnMajorLonSpacing = 5.
res@tmXBTickSpacingF = 5.
res@tmXTOn = False ; top tickmarks
res@tmXBLabelsOn = False ; do not draw bottom labels
;res@tmXBOn = False ; no bottom tickmarks
;--- Titles
res@tmXBLabelFont = 21
res@tmYLLabelFont = 21
;numPlot = dimsizes(var(0,::))
plot = new(6,graphic)
;plot1
res@gsnLeftString = varname1
res@gsnCenterString ="MERRA"
res@gsnRightString = units1
plot(0) = gsn_csm_hov(wks,merrav,res)
;plot2
res@gsnLeftString = varname2
res@gsnCenterString ="MERRA"
res@gsnRightString = units2
res@tmYLLabelsOn = False
plot(1) = gsn_csm_hov(wks,merraVort,res)
;plot3
res@gsnLeftString = varname1
res@gsnCenterString ="WRF"
res@gsnRightString = units1
res@tmYLLabelsOn = True
plot(2) = gsn_csm_hov(wks,wrfv,res)
;plot4
res@gsnLeftString = varname2
res@gsnCenterString ="WRF"
res@gsnRightString = units2
res@tmYLLabelsOn = False
plot(3) = gsn_csm_hov(wks,wrfVort,res)
;plot5
; LAST ROW
res@gsnLeftString = varname1
res@gsnCenterString ="RM3"
res@gsnRightString = units1
delete(res@tmXBLabelsOn)
res@tmYLLabelsOn = True
plot(4) = gsn_csm_hov(wks,rm3v,res)
;plot6
res@gsnLeftString = varname2
res@gsnCenterString ="RM3"
res@gsnRightString = units2
res@tmYLLabelsOn = False
plot(5) = gsn_csm_hov(wks,rm3Vort,res)
;************************************************
; create panel
;************************************************
resP = True
resP@gsnPanelFigureStrings= (/"a)","b)","c)","d)","e)","f)"/) ; add strings
to panel
resP@gsnPanelFigureStringsFontHeightF = 0.015
resP@amJust = "TopRight"
;resP@gsnMaximize = True
gsn_panel(wks,plot,(/3,2/),resP) ; now draw as one plot
(row,column)
frame(wks)
end
--
- Erik -
_______________________________________________
ncl-talk mailing list
List instructions, subscriber options, unsubscribe:
http://mailman.ucar.edu/mailman/listinfo/ncl-talk