Date: Wed Sep 26 2012 - 13:39:32 MDT
What you can do is create an array to hold 26 plots, and set plots #21, 23, and 25 to missing (or just don't generate them).
Then, do a regular panel with 13 rows and 2 columns
gsn_panel(wks,plots,(/13,2/),resP)
NCL should automatically just leave a blank spot where those last three plots are supposed to be.
See the attached example, which I stole from another example I just used a few minutes ago.
-Mary
On Sep 26, 2012, at 1:20 PM, Shabeh ul Hasson wrote:
> Dear All,
>
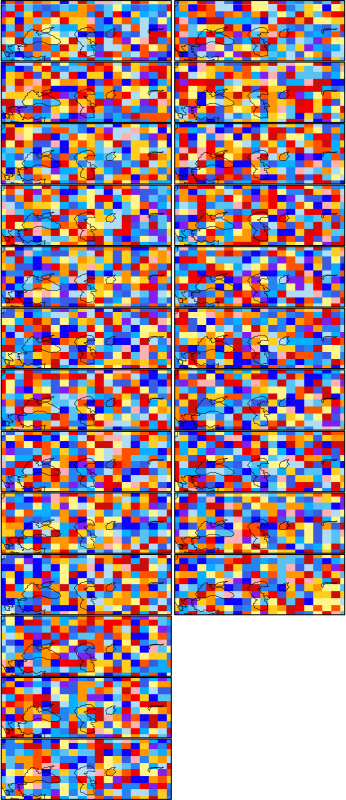
> I want to plot 13 bar graphs on left side of panel and 10 graphs on right side of panel. kindly see the attached pdf.
>
> how to get rid of 3 fake plots I have plotted by giving data 0.0 at the right side of the panel as panel requires equal number of graphs each side.
>
> best regards,
>
> Shabeh ul Hasson,
> Scientific Officer, GCISC, NCP Complex,
> Near Quaid-i-Azam University, Islamabad
> Office# +92(51)9230226,
> Fax# +92(51)2077385
> Cell# +92-321-5033864
> http://www.gcisc.org.pk
>
> P Please don't print this e-mail unless you really need to. Thank you!
> <spi_marker.pdf>_______________________________________________
> ncl-talk mailing list
> List instructions, subscriber options, unsubscribe:
> http://mailman.ucar.edu/mailman/listinfo/ncl-talk
_______________________________________________
ncl-talk mailing list
List instructions, subscriber options, unsubscribe:
http://mailman.ucar.edu/mailman/listinfo/ncl-talk
- application/octet-stream attachment: panels.ncl