Date: Wed Sep 26 2012 - 00:01:57 MDT
Hi, there,
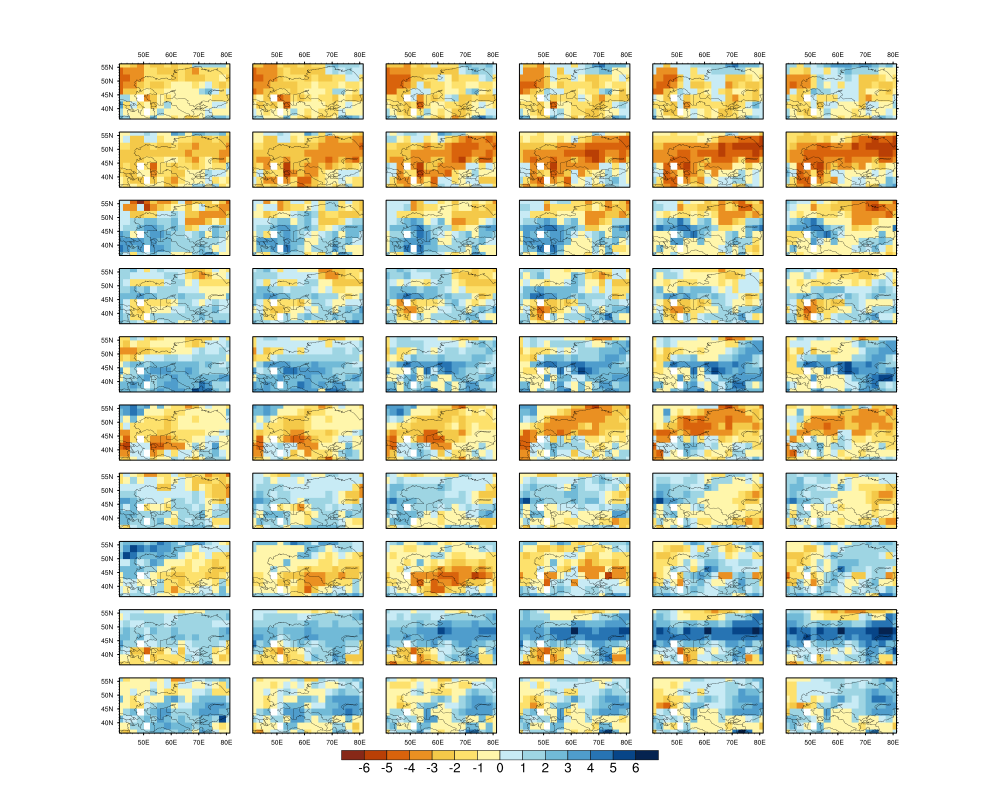
The attached plot is generated with gsn_panel approach. How do I adjust
(e.g remove) the spaces between the individual plots, so the plot area can
be fully used? I found a ncl example (panel_23.ncl), but with view point
method. I am wondering whether there is another way to do it in gsn_panel.
Plus the YR labels are missing.
Thanks!
Xin
Here is parts of script:
do i=0,10*6-1
res@tmXBLabelsOn = False ; no bottom labels
res@tmXBOn = False ; no bottom tickmarks
res@tmYRLabelsOn = False ; no right labels
res@tmYROn = False ; no right tickmarks
res@tmYLLabelsOn = False ; do not draw left labels
res@tmYLOn = False ; no left tickmarks
res@tmXTLabelsOn = False ; do not draw top labels
res@tmXTOn = False ; no top tickmarks
res@tmXBLabelFontHeightF = 0.035
res@tmYLLabelFontHeightF = 0.035
if (i .le. 5) then
res@tmXTLabelsOn = True
res@tmXTOn = True
else
res@tmXTLabelsOn = False
res@tmXTOn = False
end if
if (i .ge. 54) then
res@tmXBLabelsOn = True
res@tmXBOn = True
else
res@tmXBLabelsOn = False
res@tmXBOn = False
end if
if (i%6 .eq. 0) then
res@tmYLLabelsOn = True
res@tmYLOn = True
else
res@tmYLLabelsOn = False
res@tmYLOn = False
end if
if (i%6 .eq. 5) then
res@tmYRLabelsOn = True
res@tmYROn = True
else
res@tmYRLabelsOn = False
res@tmYROn = False
end if
plts(i) = gsn_csm_contour_map(wks,pdsi_ca(i,:,:), res)
end do
resP = True
resP@gsnFrame = False
resP@gsnMaximize = True
resP@gsnPanelCenter = False
resP@gsnPanelLabelBar = True
; resP@gsnPanelTop = 0.02
resP@txFontHeightF = .20
resP@lbLabelFontHeightF = 0.012
resP@pmLabelBarWidthF = 0.40
resP@pmLabelBarHeightF = 0.04
gsn_panel(wks,plts,(/10,6/),resP)
frame(wks)
_______________________________________________
ncl-talk mailing list
List instructions, subscriber options, unsubscribe:
http://mailman.ucar.edu/mailman/listinfo/ncl-talk