Date: Mon Dec 03 2012 - 14:06:47 MST
Dear Dave,
Thank you so much for providing the updated version of Daymet joining
script, I tested my study domain(I used the
coords.northeast.1126<ftp://ftp.cdc.noaa.gov/Public/dallured/daymet/coords.northeast.1126a.zip>.nc
for the coordinate, it seems that this coordinates looks larger than the
Northeast region but the script worked), however, when I used the following
script for the plotting:
load "$NCARG_ROOT/lib/ncarg/nclscripts/csm/gsn_code.ncl"
load "$NCARG_ROOT/lib/ncarg/nclscripts/csm/gsn_csm.ncl"
load "$NCARG_ROOT/lib/ncarg/nclscripts/csm/contributed.ncl"
;************************************************
; open file and read in data and map info
;************************************************
begin
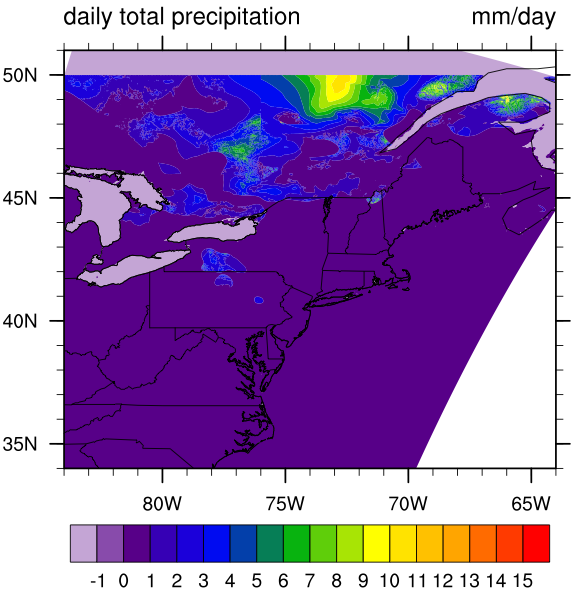
var = "tmax"
year =1980
wks = gsn_open_wks ("pdf", "tmax.NE.1980")
gsn_define_colormap (wks, "WhViBlGrYeOrRe") ; set color map
diri = "/data/ecr/yangping/DAYMET/Grid/1KM/" + var + "/"
;DAYMET/Grid/1KM/prcp/prcp.NE.1981.nc
;NE_19800125_prcp.nc ; input directory
;NE_all_1997_correct_tmin.nc
;fili = "NE_all_" + year + "_correct_" + var+ ".nc"
fili = var + ".NE." + year + ".nc"
f = addfile (diri+fili, "r")
x = f->$var$(0,:,:) ; read sample data grid
printVarSummary(x)
date = "January 25" ; note the corresponding date
x@lat2d = f->lat ; read 2-D coordinates
x@lon2d = f->lon ; and attach to data array
x = where (ismissing (x), -900, x) ; make no-data areas visible
res = True
res@mpMinLatF = 34 ; Wyoming and vicinity
res@mpMaxLatF = 51
res@mpMinLonF = -84
res@mpMaxLonF = -64
res@cnFillOn = True
res@cnLinesOn = False
res@gsnSpreadColors = True
res@gsnSpreadColorStart = 8
res@cnLevelSelectionMode = "ManualLevels"
res@cnLevelSpacingF = 1 ; set fixed contour range
res@cnMinLevelValF = -1 ; for precip
res@cnMaxLevelValF = 15
res@mpFillOn = False ; turn off map fill
res@mpOutlineOn = True ; show state outlines
res@mpOutlineBoundarySets = "geophysicalandusstates"
; res@tiMainString = "Daymet Tile " + dirs(pi) + ", " + date
res@tiMainFontHeightF = 0.020
plot = gsn_csm_contour_map_ce (wks, x, res)
delete (x)
end
I found the graph a little weird:
[image: Inline image 1]
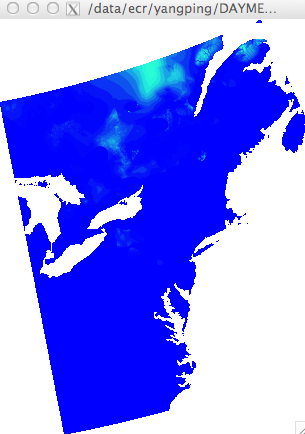
but when I use ncview to view the file, it seems OK:
[image: Inline image 2]
Have you even found this problem?
Looking forward to hearing from you.
Best Regards,
Ping
_______________________________________________
ncl-talk mailing list
List instructions, subscriber options, unsubscribe:
http://mailman.ucar.edu/mailman/listinfo/ncl-talk