Date: Wed Jan 02 2013 - 05:48:03 MST
Dear all,
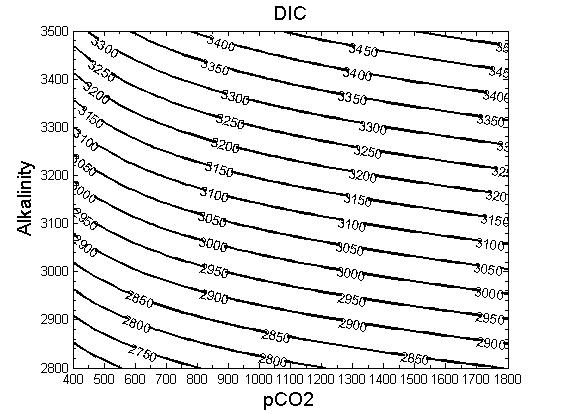
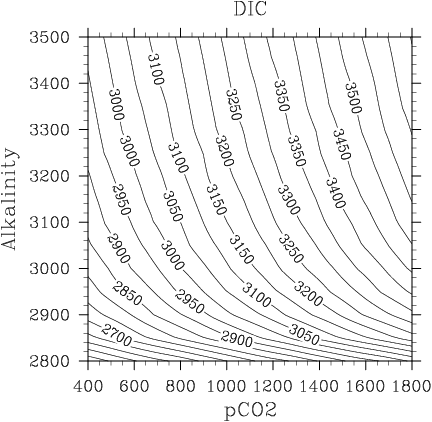
I am using the same data set to produce contour plots with MATLAB and NCL.
The resulting plots show significant differences. I used "natgrid" for
gridding data in NCL, which uses natural neighbor interpolation. MATLAB
plot was also produced with the very same natural neighbor interpolation
method. However, somehow, there are significant differences which I could
not understand why. I would be glad if you have any suggestions. The two
plots and the NCL code are attached to this e-mail.
Regards,
--
Ekin Akoglu
Institute of Marine Sciences
Middle East Technical University
P.O. Box 28, 33731
Erdemli, Mersin
Turkey
Web: www.ims.metu.edu.tr
Email: ekin@ims.metu.edu.tr
Phone: +90 324 521 34 34
GSM: +90 506 554 03 90
_______________________________________________
ncl-talk mailing list
List instructions, subscriber options, unsubscribe:
http://mailman.ucar.edu/mailman/listinfo/ncl-talk