Date: Wed Feb 06 2013 - 15:18:59 MST
Hallo NCL,
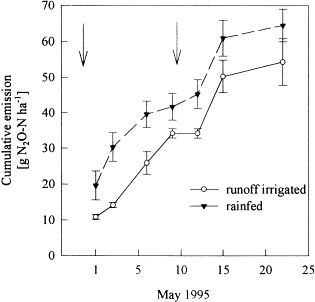
I just wonder if It's possible to put standard deviation above and below
each point on xy plots
as I attached here.
Thanks
_______________________________________________
ncl-talk mailing list
List instructions, subscriber options, unsubscribe:
http://mailman.ucar.edu/mailman/listinfo/ncl-talk
