Hi,
there are few good examples of producing an attachment xy plot to the y-axis (left of a base plot), eg
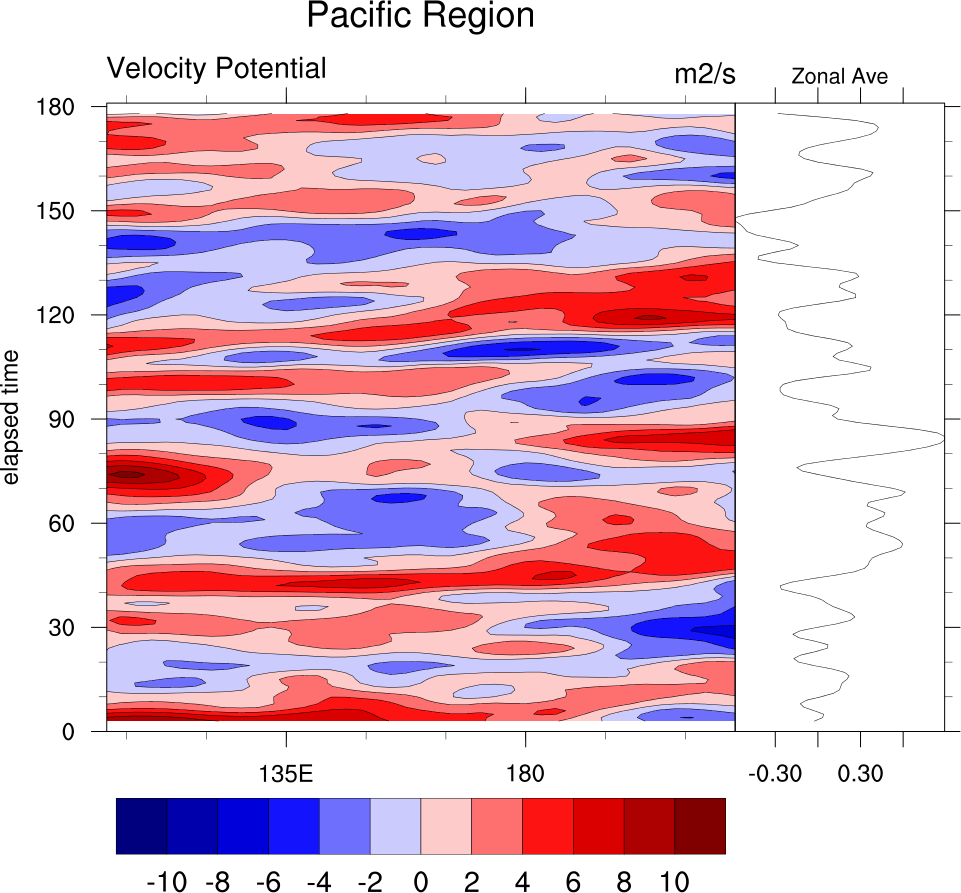
http://www.ncl.ucar.edu/Applications/Images/panel_10_lg.png
however i can't find any examples of attaching a xy plot to the x-axis (bottom or top of a base plot) of a geographical (lat,lon) plot
and my numerous tests fail. Does someone have a simple example script to illustrate how to do this?
Thanks,
Mark.
_______________________________________________
ncl-talk mailing list
List instructions, subscriber options, unsubscribe:
http://mailman.ucar.edu/mailman/listinfo/ncl-talk
Received on Tue Apr 2 18:09:29 2013
This archive was generated by hypermail 2.1.8 : Tue Apr 02 2013 - 21:23:48 MDT