Date: Wed Apr 03 2013 - 06:15:27 MDT
Hi everyone,
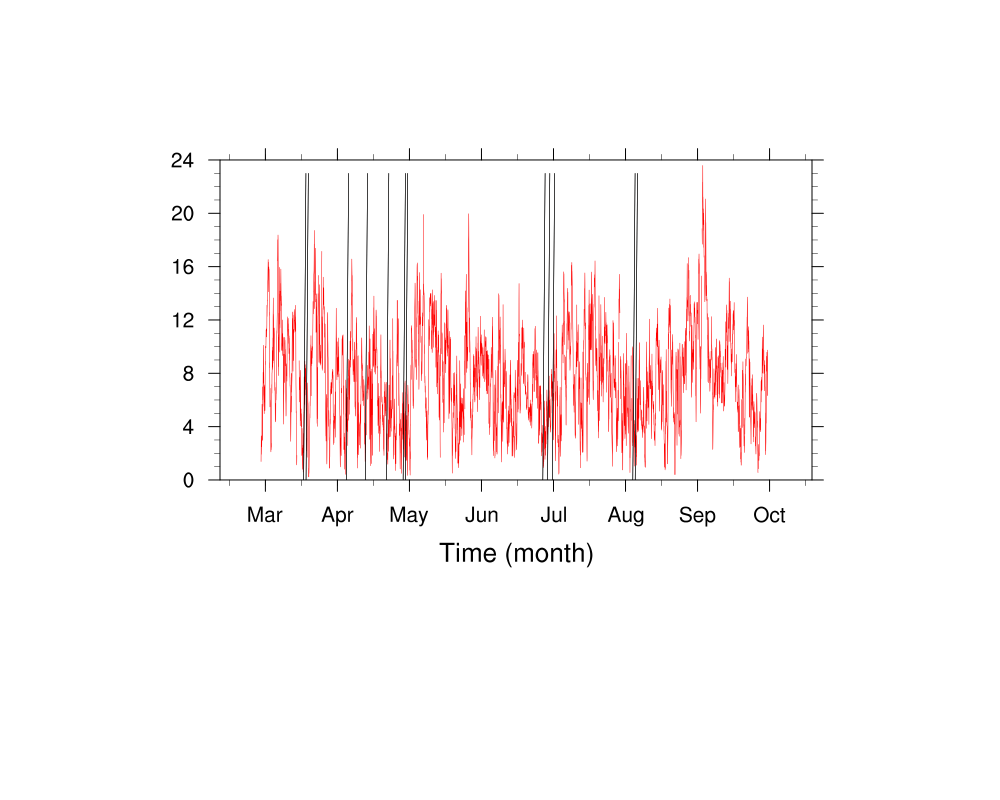
I've been trying to draw a time series with particular days highlighted by using the function gsn_add_polygon. Essentially I wish to draw the time series and highlight events by plotting vertical bars at different points in the time series.
A couple of issues have sprung up. Firstly, the bars do not span the y-axis (despite increasing the y coordinate of the polygon) and I'm not sure I understand why. Secondly, I can't change the colors of the polygons, they just remain black. I've attached both the code and the resulting plot. Does anyone has any ideas as to how I can fix this?
cheers
Chris
Christopher Steele,
School of Environmental Sciences
University of East Anglia
Norwich
________________________________________
_______________________________________________
ncl-talk mailing list
List instructions, subscriber options, unsubscribe:
http://mailman.ucar.edu/mailman/listinfo/ncl-talk
- application/octet-stream attachment: offshore_long_tseries.ncl