Date: Tue Apr 23 2013 - 15:28:06 MDT
Hello,
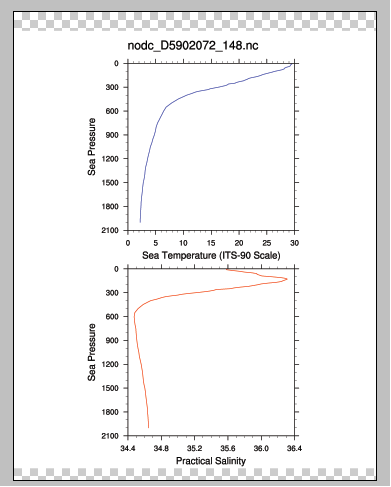
I was working with ARGO dataset and I was able to project graphs of Temperature versus Pressure and Practical Salinity versus Pressure with the help of the code which is attached in this mail as "argo.ncl" and currently am trying to merge three separate graphs of one ARGO Float into one XY plot and am finding it difficult to do the coding of it. I tried my best but still am not able to get it done. The one of the images for the graphs of the particular float of the attached dataset is attached with this mail.
Can you please help me out with the functions needed to merge the graphs because am still the beginner and self learner of NCL?
Attached file names and their content:
1). Argo_072 - image file for the graph 2). Three ".ps" files for the one ARGO Float 3). NCL code which I had used to project these graphs, i.e. "argo.ncl".
Thanks and best regards.
Sachin Ravilesh Nand | Software Engineer (Consultant) B.C.A (Bangalore University-India) European Union Global Climate Change Alliance Project.
Pacific Centre for Environment and Sustainable Development.
University of the South Pacific.
E: sachin.nand@usp.ac.fj
T: (+679) 32 32205
_______________________________________________
ncl-talk mailing list
List instructions, subscriber options, unsubscribe:
http://mailman.ucar.edu/mailman/listinfo/ncl-talk
- application/postscript attachment: nodc_D5902072_148.ps
- application/postscript attachment: nodc_D5902072_149.ps
- application/postscript attachment: nodc_D5902072_150.ps
- application/octet-stream attachment: argo.ncl