Date: Wed Apr 17 2013 - 12:49:19 MDT
---------- Forwarded message ----------
From: Zhifeng Yang <yangzf01@gmail.com>
Date: Fri, Apr 12, 2013 at 3:50 PM
Subject: How to plot contour image in NCL
To: ncl-talk <ncl-talk@ucar.edu>
Hi all
I am trying to think how NCL plots contour images. As we know, NCL will
classify the database into different bins. For instance,
a = ispan(0, 100, 1)
res@cnMinLevelValF = 0
res@cnMaxLevelValF = 100
res@cnLevelSpacingF = 10
Then NCL will group array a info 10 bins with different data into different
bins. And assign different color into different bins, so that you can only
have one color for one bin. The data in one bin can be in different points.
Finally you will get a polygon and apply the color in this bin to this
polygon. Then you can use related function to plot it.
My question is how NCL identifies the boundary coordinates of the polygon
in order to plot it with different colors.
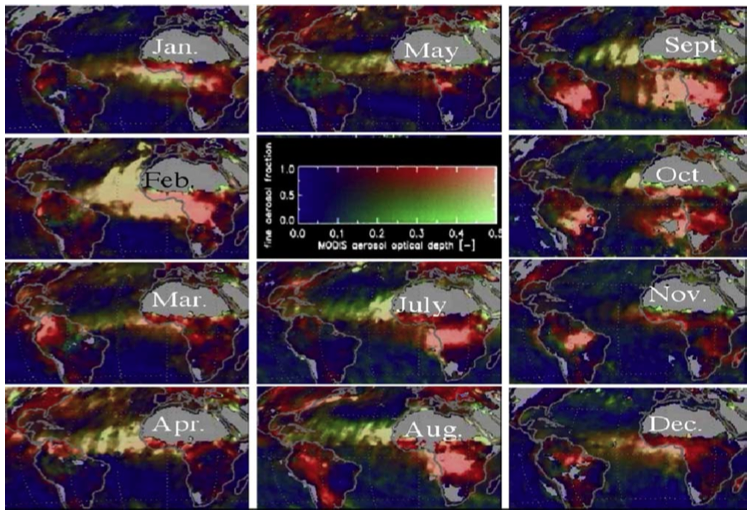
Regarding to my question, I am trying to plot a contour image with
2-Dimensional color table. It looks like the following
[image: Inline image 1]
Actually I have gotten this plot with another method. I created a 2-D color
bar first, and then convert the 2-D color bar into 1-D color map. Finally
use this color map to plot the 2 variables one point by one point. So I can
get the image like the above.
To be more efficient, I intend to plot this image using contour. That will
make the process more realistic.
Thank you
Bruce
_______________________________________________
ncl-talk mailing list
List instructions, subscriber options, unsubscribe:
http://mailman.ucar.edu/mailman/listinfo/ncl-talk