Date: Mon Apr 29 2013 - 09:42:27 MDT
Dear all,
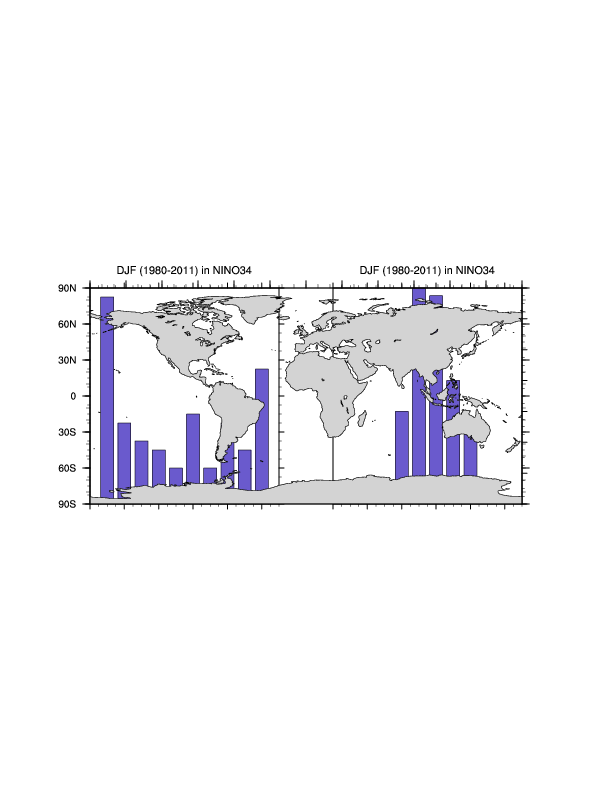
I tried to overlay a bar chart on a map. My idea is that I will later place the bar charts (talagrand or whatever) over the region I am investigating. For example I divide the globe in regions of 45x45 degrees, investigate my statistics and place the barchart in this region.
I started with just 2 bar charts but was not really able to place the bar chart on top of the map. I tried to use example nr 6 from the overlay plots but probably I messed up the post/Predraws?
Has anybody already tried such a figure? I put the plot code below, perhaps there is an obviously wrong part?
Thanks in advance, Kristina
;++++++++ Plot the Talagrand using Bar-Charts
wks = gsn_open_wks("ps" , "TALAGRAND")
plot_t = new(2,graphic)
res = True ; plot mods desired
res@gsnFrame = False ; don't advance frame yet
res@gsnDraw = True
res@pmLegendDisplayMode = "Never"
res@gsnXYBarChart = True ; turn on bar chart
res@gsnXYBarChartBarWidth = 0.75 ; change bar widths
res@tmXBOn = False ; turn off tickmarks at bot
res@trYMinF = 0 ; bring bars down to zero
res@trXMinF = 0 ; adds space on either end
res@trXMaxF = dimsizes(talagrand)+1 ; of the 1st and last bars
res@gsnXYBarChartColors = (/"SlateBlue"/) ; choose colors
tres= res
tres@vpWidthF = 0.35 ; So they can all fit on same page.
tres@vpHeightF = 0.4
tres@tiYAxisString = " " ;Number of Observations "
tres@tiXAxisString = " " ;Talagrand "
tres@tiMainString = season+" ("+syear+"-"+eyear+") in "+region
xpos = (/0.1,0.55/) ; X positions for plots
ypos = (/0.7/) ; Y positions for plots
x = ispan(1,dimsizes(talagrand),1)
x_D = ispan(1,dimsizes(talagrand_D),1)
printVarSummary(x)
tres@tiXAxisString = "" ;"Kristinas Talagrand for T2m"
tres@vpYF = ypos(0)
tres@vpXF = xpos(0)
tres@xyCurveDrawOrder = "PostDraw"
tres@tmXBOn = True
tres@tmXBLabelsOn = False
tres@tmYLOn = True
tres@tmYLLabelsOn = False
plot_t(0) = gsn_csm_xy (wks,x,talagrand,tres) ; create plot
tres@vpYF = ypos(0)
tres@vpXF = xpos(1)
tres@tmXBOn = True
tres@tmXBLabelsOn = False
tres@tmYLOn = False
tres@tmYROn = True
tres@tmYLLabelsOn = False
tres@tmYLLabelsOn = True
tres@tiYAxisString = ""
tres@tiXAxisString = ""
mpres = res
mpres@mpOutlineDrawOrder = "PostDraw"
mpres@mpFillDrawOrder = "PreDraw"
mpres@mpLabelsOn = False
mpres@mpPerimOn = True
mpres@mpGridAndLimbOn = False
mpres@mpFillOn = True
mpres@mpOutlineOn = True
mpres@mpGridAndLimbDrawOrder = "PreDraw"
map = gsn_csm_map_ce(wks,mpres) ; draw global map
overlay(map,plot_t)
maximize_output(wks,True)
_______________________________________________
ncl-talk mailing list
List instructions, subscriber options, unsubscribe:
http://mailman.ucar.edu/mailman/listinfo/ncl-talk