Date: Sun Jun 30 2013 - 11:33:21 MDT
Hallo NCL,
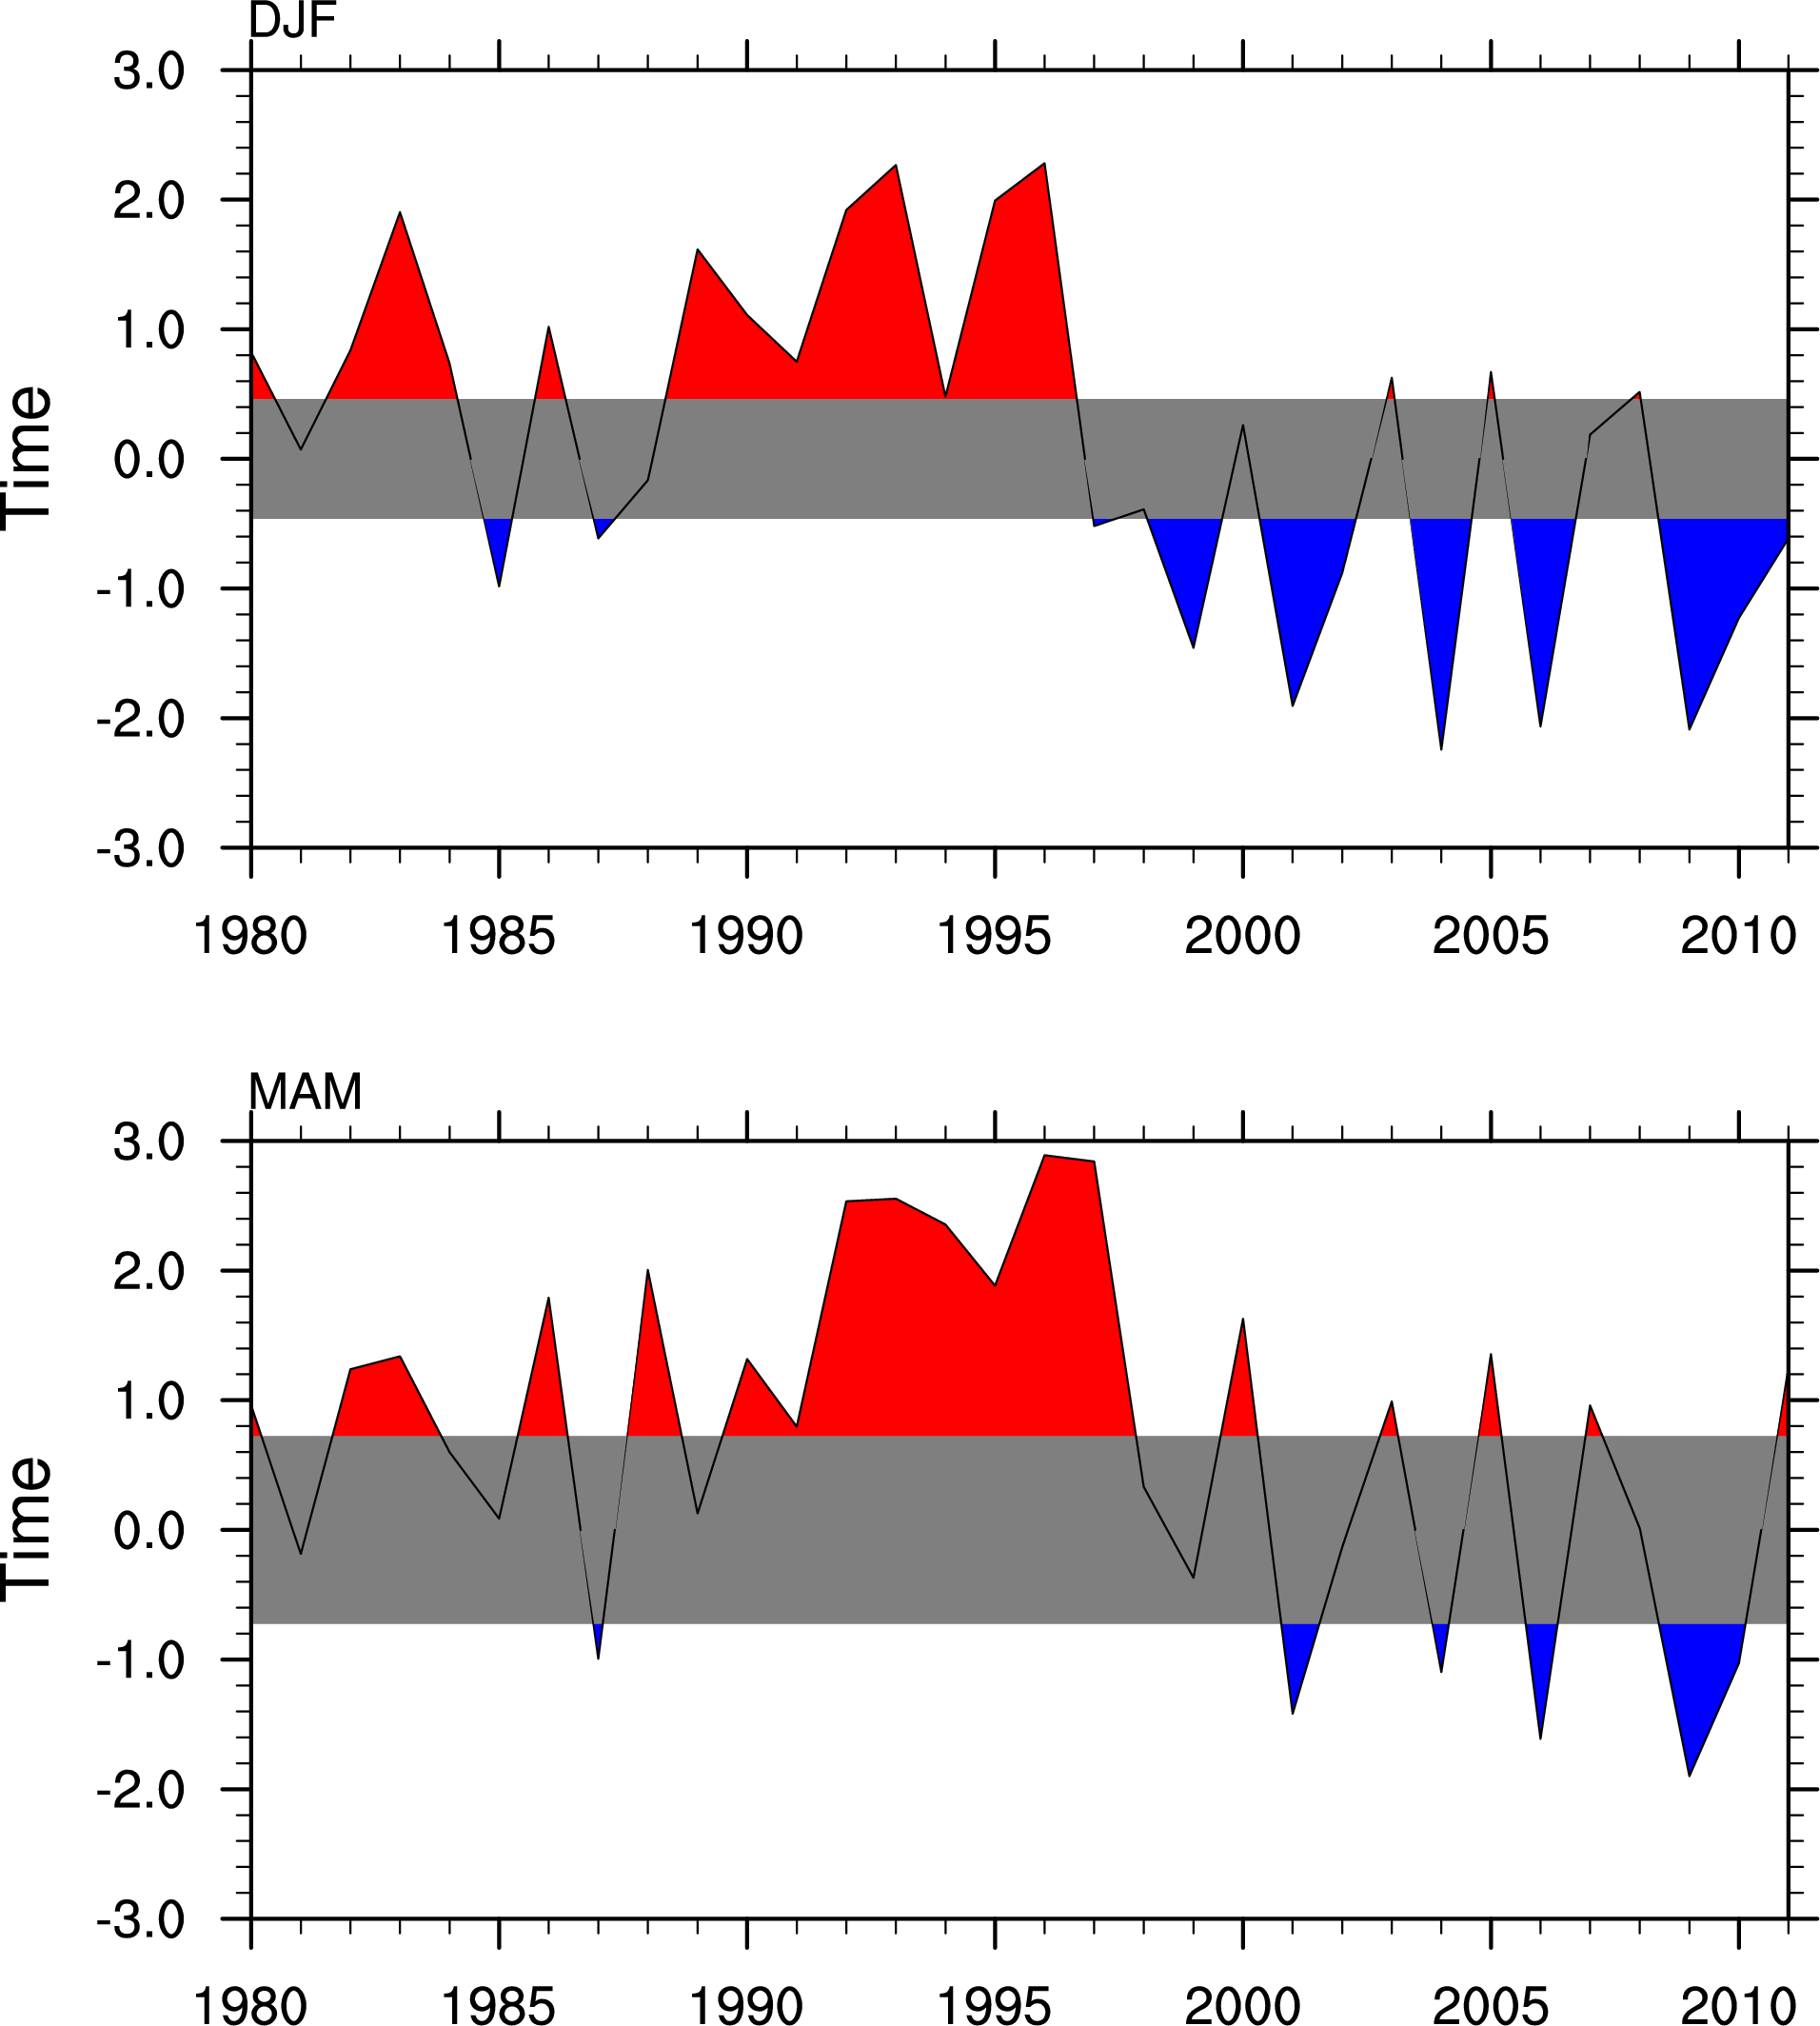
Sorry fow a simple question. I just wonder why the draworder did not solve
my problem to put the polygon behind the bar chart. Here is my resources
settings:
wks = gsn_open_wks ("pdf", "bar" )
res = True
res@gsnScale = True
plot = new(2,graphic)
res@gsnDraw = False ; don't draw
res@gsnFrame = False
res@vpXF = 0.14 ; In page coordinates, where to start
res@vpYF = 0.75 ; the plot
res@vpHeightF = 0.43 ; Changes the aspect ratio
res@vpWidthF = 0.85
res@trYMinF = -3.0 ; min value on y-axis
res@trYMaxF = 3.0 ; max value on y-axis
res@tiYAxisString = "Time" ; y-axis label
res@tiMainString = " " ; title
res@gsnLeftString = "DJF"
res@gsnYRefLine = 0. ; reference line
res@gsnXYBarChart = False ; create bar chart
res@gsnAboveYRefLineColor = "red" ; above ref line fill red
res@gsnBelowYRefLineColor = "blue" ; below ref line fill blue
;===============================================================================
nk = 32
time = ispan(1980,2011,1)
xp = new( (/2*nk/), float )
yp = new( (/2*nk/), float )
do i=0,nk-1
yp(i) = 3*climJFM(0)
xp(i) = time(i)
xp(2*nk-1-i) = time(i)
yp(2*nk-1-i) = -3*climJFM(0)
end do
nk1 = 32
time1 = ispan(1980,2011,1)
xp1 = new( (/2*nk1/), float )
yp1 = new( (/2*nk1/), float )
do i=0,nk1-1
yp1(i) = 1*climJFM(1)
xp1(i) = time(i)
xp1(2*nk1-1-i) = time(i)
yp1(2*nk1-1-i) = -1*climJFM(1)
end do
;===============================================================================
plot(0) = gsn_csm_xy (wks,ispan(1980,2011,1),JFM(0,:),res)
res@gsnLeftString = "MAM"
delete(res@tiMainString)
gsres = True ; poly res
gsres@tfPolyDrawOrder = "Draw" ; draw this first
gsres@gsFillColor = "SlateGray"
dummy = gsn_add_polygon (wks,plot(0),xp,yp,gsres)
plot(1) = gsn_csm_xy (wks,ispan(1980,2011,1),JFM(1,:),res)
gsres1 = True ; poly res
gsres1@tfPolyDrawOrder = "Draw" ; draw this first
gsres1@gsFillColor = "SlateGray"
dummy1 = gsn_add_polygon (wks,plot(1),xp1,yp1,gsres1)
gsn_panel(wks,plot,(/2,1/),False)
end
thank you,
--
Regards,
Dr. Verena.
_______________________________________________
ncl-talk mailing list
List instructions, subscriber options, unsubscribe:
http://mailman.ucar.edu/mailman/listinfo/ncl-talk