Date: Tue Jul 30 2013 - 08:55:05 MDT
Dear ncl users,
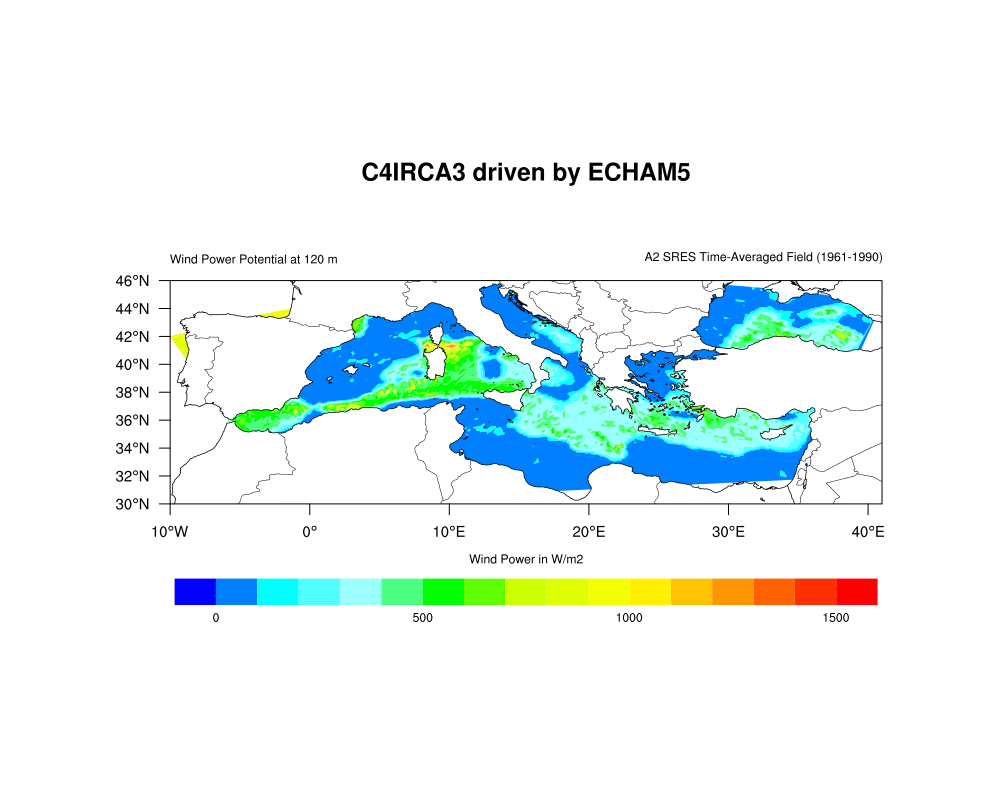
I try to plot the wind power potential over Mediterranean Sea, using the
attached script Plotting_WP3.ncl and the input .txt file. The script worked
fine and a full domain plot was made (Attached Ioannis_1.png file). However,
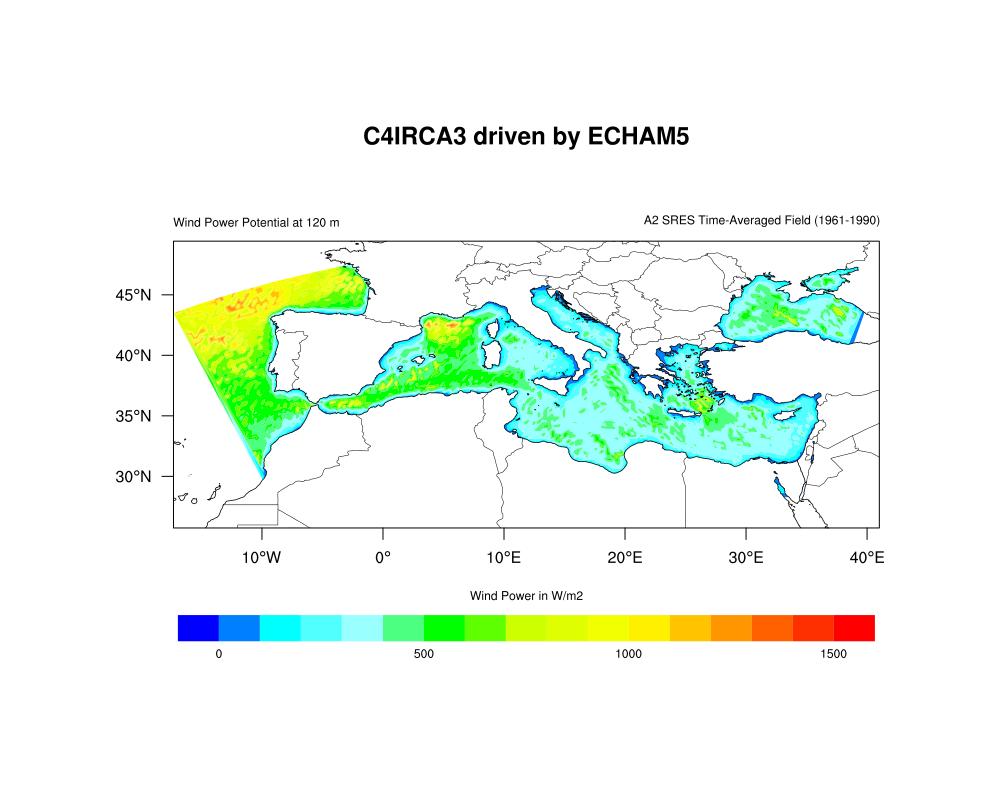
I would like to zoom in to a specific area. Firstly, I modified the
mpLimitMode from LatLon to Corners
> mpres@mpLimitMode = "Corners"
> mpres@mpLeftCornerLatF = 30.
> mpres@mpLeftCornerLonF = -10.
> mpres@mpRightCornerLatF = 46.
> mpres@mpRightCornerLonF = 41.
and the contour data failed to align to the basemap lat/lon (Attached
Ioannis.png file). The same problem persisted when I kept the LatLon limit
mode
> mpres@mpLimitMode = "LatLon"
> mpres@mpMinLatF = 30.
> mpres@mpMaxLatF = 46.
> mpres@mpMinLonF = -10.
> mpres@mpMaxLonF = 41.
I think that the causes of the problem are the same, but I cannot find
them...
Is it possible to do the right zoom avoiding the above problem?
Please let me know if there is any way..
Thanks a lot
Regards
Ioannis
Attached Script
;*************************************************
load "$NCARG_ROOT/lib/ncarg/nclscripts/csm/gsn_code.ncl"
load "$NCARG_ROOT/lib/ncarg/nclscripts/csm/gsn_csm.ncl"
begin
;
; Data is stored in four columns: grid_point_number lat lon windpop
; Read in each line as a string, and use "str_get_field" to
; read in the fields of interest.
;
fname = "WindPower_Med_C_C4I_A2.txt"
lines = asciiread(fname,-1,"string")
;
; Use "str_get_field" to indicate which fields to read in. Each field
; is separated by spaces.
;
lat = stringtofloat(str_get_field(lines(0:),2," "))
lon = stringtofloat(str_get_field(lines(0:),3," "))
wpo = stringtofloat(str_get_field(lines(0:),4," "))
pollat = 39.25
pollon = -162.0
minlat = min(lat)
maxlat = max(lat)
minlon = min(lon)
maxlon = max(lon)
delete(lines) ; Remove arrays we don't need anymore.
;======================================================================
; Start graphic section - LaberBar:Part I
;======================================================================
wks = gsn_open_wks("png", "Ioannis") ; make png image
gsn_define_colormap(wks,"BlAqGrYeOrRe") ; choose color map
res = True ; plot mods desired
res@gsnMaximize = True ; maxmize plot in frame
res@cnFillOn = True ; turn on color
res@gsnSpreadColors = True ; automatically choose the
fill colors
res@cnLinesOn = False ; no contour lines
res@cnLevelSelectionMode = "ManualLevels" ; manually set cont levels
res@cnMinLevelValF = 0.0 ; min level
res@cnMaxLevelValF = 1500.0 ; max level
res@cnLevelSpacingF = 100 ; contour spacing
res@cnLineLabelsOn = False ; no contour labels
; =====================================================================
; Create Map and Mask Land
; =====================================================================
res@sfXArray = lon
res@sfYArray = lat
res@mpDataBaseVersion = "MediumRes" ; use finer database
res@mpDataSetName = "Earth..4"
res@mpProjection = "CylindricalEquidistant"
res@mpOutlineBoundarySets = "National"
res@mpFillOn = True ; true for masking
res@mpGeophysicalLineThicknessF = 1.5
res@mpAreaMaskingOn = True ; masking land
res@mpMaskAreaSpecifiers = "Ocean"
res@mpLandFillColor = 0
res@mpFillDrawOrder = "PostDraw"
;=====================================================================
; Create Laber Bar - LaberBar: Part II
;=====================================================================
res@lbLabelAngleF = 0 ; angle labels
res@lbLabelFontHeightF =.010 ; make labels larger
res@lbTitleOn = True ; turn on title
res@lbTitleString = "Wind Power in W/m2"
res@lbTitleFontHeightF = .010 ; make title smaller
res@pmLabelBarOrthogonalPosF = .20 ; move whole thing down
res@cnInfoLabelOn = False ; turn off contour info
label
res@lbAutoManage = False ; we control label bar
res@pmLabelBarDisplayMode = "Always" ; turns on label bar
res@lbOrientation = "Horizontal" ; ncl default is vertical
res@pmLabelBarSide = "Bottom" ; default is right
res@lbLabelAutoStride = False ; skip every other label
res@pmLabelBarWidthF = 0.8 ; default is shorter
res@pmLabelBarHeightF = 0.1 ; default is taller
res@lbPerimOn = False ; default has box
res@lbBoxLinesOn = False
res@lbLabelStride = 5 ; skip values on laberbar
res@pmTickMarkDisplayMode = "conditional"
res@gsnAddCyclic = False
;=====================================================================
; Set titles
;=====================================================================
res@gsnRightString = "A2 SRES Time-Averaged Field (1961-1990)"
; write a text up&right below title
res@gsnRightStringFontHeightF = .010 ; right title font size
res@gsnLeftString = "Wind Power Potential at 120 m"
res@gsnLeftStringFontHeightF = .010 ; left title font size
res@tiMainString = "C4IRCA3 driven by ECHAM5" ; set the main title
res@tiMainFontHeightF = .020 ; main title font size
res@tfDoNDCOverlay = True
; ====================================================================
; Zoom in on map
; ====================================================================
res@mpLimitMode = "LatLon"
res@mpMinLatF = minlat
res@mpMaxLatF = maxlat
res@mpMinLonF = minlon
res@mpMaxLonF = maxlon
res@pmTickMarkDisplayMode = "Always"
map = gsn_csm_contour_map(wks,wpo,res)
end
_______________________________________________
ncl-talk mailing list
List instructions, subscriber options, unsubscribe:
http://mailman.ucar.edu/mailman/listinfo/ncl-talk
- application/octet-stream attachment: Plotting_WP3.ncl
- text/plain attachment: WindPower_Med_C_C4I_A2.txt