Date: Wed Sep 04 2013 - 12:27:16 MDT
Hi,
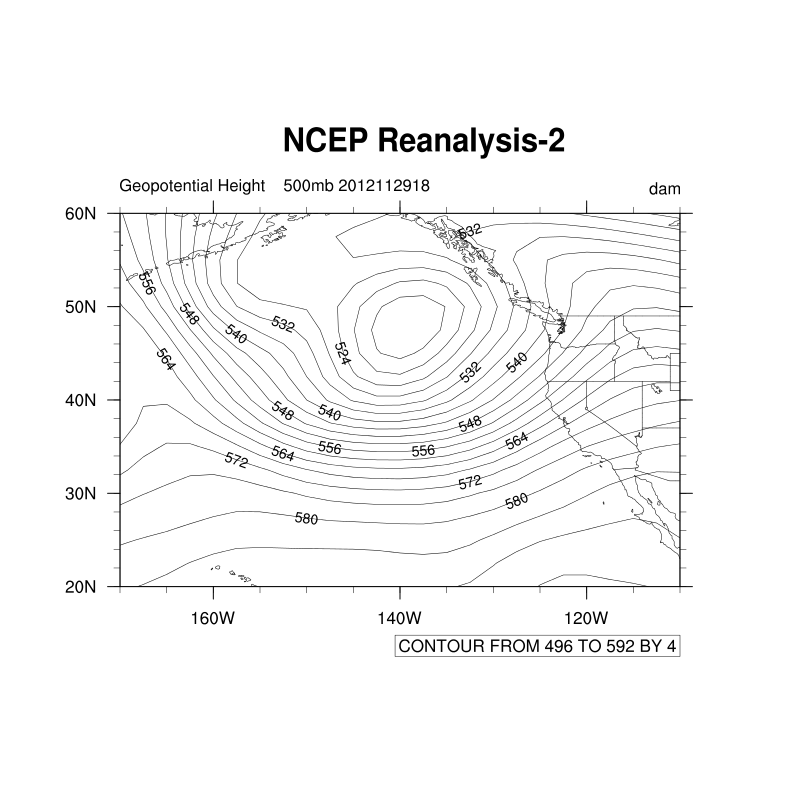
I am trying to put high/low label marks on my contour map of 500 mb
geopotential height surface but for some reason it does not seem to be
working. Here is my script below:
;==============================================================
load "$NCARG_ROOT/lib/ncarg/nclscripts/csm/gsn_code.ncl"
load "$NCARG_ROOT/lib/ncarg/nclscripts/csm/gsn_csm.ncl"
load "$NCARG_ROOT/lib/ncarg/nclscripts/csm/contributed.ncl"
load "$NCARG_ROOT/lib/ncarg/nclscripts/contrib/calendar_decode2.ncl"
;==============================================================
begin
f = addfile("./hgt.2012.nc","r")
;geopotential height
hgt = short2flt(f->hgt) ; hgt(time,lev,lat,lon)
; short2flt() function uses scale_factor and
add_offset attribute to convert
hgt = hgt/(10.0)
hgt@units = "dam"
hgt@description = "Geopotential Height"
time = f->time
ntimes=dimsizes(time)
lat = f->lat
lon = f->lon
lev = f->level
nlat = dimsizes(lat)
nlon = dimsizes(lon)
;convert times to dates
times =fspan(time@actual_range(0),time@actual_range(1),ntimes)
times@units= "hours since 1800-1-1 00:00:00"
dates = calendar_decode2(times,-3)
print(dates)
;create lat2d and lon2d arrays
;lat2d = conform_dims((/nlat,nlon/),lat,0)
;lon2d = conform_dims((/nlat,nlon/),lon,1)
;hgt@lat2d = lat2d
;hgt@lon2d = lon2d
;---------------------------------------------------------------
;Plot
;---------------------------------------------------------------
;What level do you want to plot?
plev = 500.
dateStart = ind(dates.eq."2012112800")
dateEnd = ind(dates.eq."2012120318")
;do i=0,0 ; begin plotting loop
fname = "500mb-"+dates(1335)
wks = gsn_open_wks("png",fname)
;plot resources
res = True
res@tiMainString = " NCEP Reanalysis-2"
res@tiMainFontAspectF = 1.4
res@tiMainFontThicknessF = 0.80
res@tiMainFontHeightF = 0.03
res@gsnAddCyclic = False ; regional data
res@tfDoNDCOverlay = False
colr="black"
res@mpFillOn = False
res@mpGeophysicalLineColor = colr ; color of continental
outlines
res@mpPerimOn = True ; draw box around map
res@mpGridLineDashPattern = 2 ; lat/lon lines as
dashed
res@mpDataBaseVersion = "MediumRes"
res@mpOutlineBoundarySets = "GeophysicalAndUSStates" ; add state
boundaries
res@mpUSStateLineColor = colr
res@mpGeophysicalLineColor = colr
res@mpNationalLineColor = colr
res@mpUSStateLineColor = colr
res@mpGridLineColor = colr
res@mpLimbLineColor = colr
res@mpPerimLineColor = colr
res@mpGeophysicalLineThicknessF = 1.0
res@mpGridLineThicknessF = 1.0
res@mpLimbLineThicknessF = 1.0
res@mpNationalLineThicknessF = 1.0
res@mpUSStateLineThicknessF = 1.0
res@cnLevelSpacingF = 4
res@cnLineLabelFontHeightF = 0.011
res@cnHighLabelsOn = True; label highs
res@cnHighLabelString = "H"; highs' label
res@cnHighLabelFontHeightF = 0.013; larger H labels
; res@cnHighLabelBackgroundColor = "Transparent"; no box
res@cnLowLabelsOn = True; label lows
res@cnLowLabelString = "L"; lows' label
res@cnLowLabelFontHeightF = 0.013; larger L labels
; res@cnLowLabelBackgroundColor = "Transparent"; no box
res@mpLimitMode="LatLon"
res@mpMinLatF = 20
res@mpMaxLatF = 60
res@mpMinLonF = -170
res@mpMaxLonF = -110
res@gsnLeftStringFontHeightF=0.015
res@gsnRightStringFontHeightF=0.015
res@gsnLeftString = hgt@description+" "+flt2string(plev)+"mb " +
dates(1335)
res@gsnRightString= hgt@units
plot = gsn_csm_contour_map_ce(wks,hgt(1335,ind(lev.eq.plev),:,:),res)
;end do
end
I've attatched an image to show what it looks like so far.
Any help would be much appreciated.
Thanks,
--
Arthur J. Eiserloh, Jr.
San Jose State University
Graduate Student
Dept. of Meteorology and Climate Science
_______________________________________________
ncl-talk mailing list
List instructions, subscriber options, unsubscribe:
http://mailman.ucar.edu/mailman/listinfo/ncl-talk