Date: Sun Sep 29 2013 - 11:32:01 MDT
I did it the same way like it is done in the snippet you sent me. My
script is now as follows:
;************************************************************
; Target Classification 2D
;************************************************************
;************************************************************
load "$NCARG_ROOT/lib/ncarg/nclscripts/csm/gsn_code.ncl"
load "$NCARG_ROOT/lib/ncarg/nclscripts/csm/gsn_csm.ncl"
load "$NCARG_ROOT/lib/ncarg/nclscripts/csm/contributed.ncl"
;************************************************************
begin
;************************************************************
;creation of filenames for loop
;************************************************************
;do j=10,31
day ="17"
month ="02"
year ="2013"
rest ="_lindenberg_classification"
directory ="/localdata/Lohmueller/BA/Daten_Lindenberg/Classification/"
type ="nc"
filename = directory+year+month+day+rest
;************************************************************
;read in data for contour plot
;************************************************************
a = addfile (filename+"."+type , "r")
;a=addfile("/localdata/Lohmueller/BA/Daten_Lindenberg/Classification/20130101_lindenberg_classification.nc",
"r")
time=a->time
tar=a->target_classification
height=a->height
TAR = tar(height|:,time|:) ;switch atts
TAR@units=" "
TAR@long_name= " "
time@units=" "
time@long_name= " "
height@units=" "
height@long_name=" "
height@standard_name=" "
;print(TAR(:,2))
;************************************************************
;read in data for polyline
;************************************************************
path = "/localdata/Lohmueller/BA/Amdardaten/Flutra01JanDLH_3_049.txt"
data = asciiread(path,(/40,3/),"float")
ntime=40
wks= gsn_open_wks("pdf","Notflug")
;************************************************************
;the data slice
;************************************************************
slice=TAR(:,:)
;**********************************************
;polyline parameters
;**********************************************
x= new(ntime,float)
y= new(ntime,float)
vi= new(ntime,float)
;**********************************************
;put values to variable for polyline
;**********************************************
do i=0,ntime-1
x(i)=data(i,0) ;extract distance (normally:extract latitude(Breite(N)))
y(i)=data(i,1) ;extract height (normally:extract longitude(Lšnge(E)))
vi(i)=data(i,2) ;extract Icing
end do
;print(x)
;print(y)
gsn_define_colormap(wks,"BkBlAqGrYeOrReViWh200")
;***********************************************
;resources contour plot
;***********************************************
res = True
res@gsnDraw = False
res@gsnFrame = False
res@gsnMaximize = True
res@gsnPaperOrientation = "landscape"
res@cnFillOn = True
;res@cnCellFillEdgeColor = "black"
res@cnFillMode = "CellFill"
res@cnLinesOn = False
res@cnLineLabelsOn = False
res@cnLevelSelectionMode = "ManualLevels" ; set manual
contour levels
res@lbLabelAlignment = "BoxCenters"
res@cnMinLevelValF = 0.1 ; set the minimum contour level
res@cnMaxLevelValF = 9 ; set the maximum contour level
res@cnConstFLabelConstantSpacingF = 1
res@cnFillColors =
(/201,20,38,54,71,91,102,119,134,156,170/) ; set the colors to
be used
res@cnLevelSpacingF = 1
res@tiYAxisString = "Hoehe (m)" ; y axis title
res@tiXAxisString = "Strecke (m)" ; x axis title
res@tiYAxisFontHeightF = 0.01
res@tiXAxisFontHeightF = 0.01
res = True
;res@lbAutoManage = True
res@lbLabelAutoStride = False
res@lbPerimOn = False
res@lbOrientation = "Vertical"
;res@lbOrientation = "Default"
res@lbLabelStride = 1
res@lbLabelStrings = (/"Klarer
Himmel","Wolkentropfen","Niesel & Regen","Niesel/Regen &
Wolkentropfen", "Eis", "Eis & unterkuehlte Tropfen", "Schmelzendes
Eis", "Schmelzendes Eis & Wolkentropfen","Aerosole",
"Insekten","Aerosole & Insekten"/)
res@lbLabelFontHeightF = 0.01
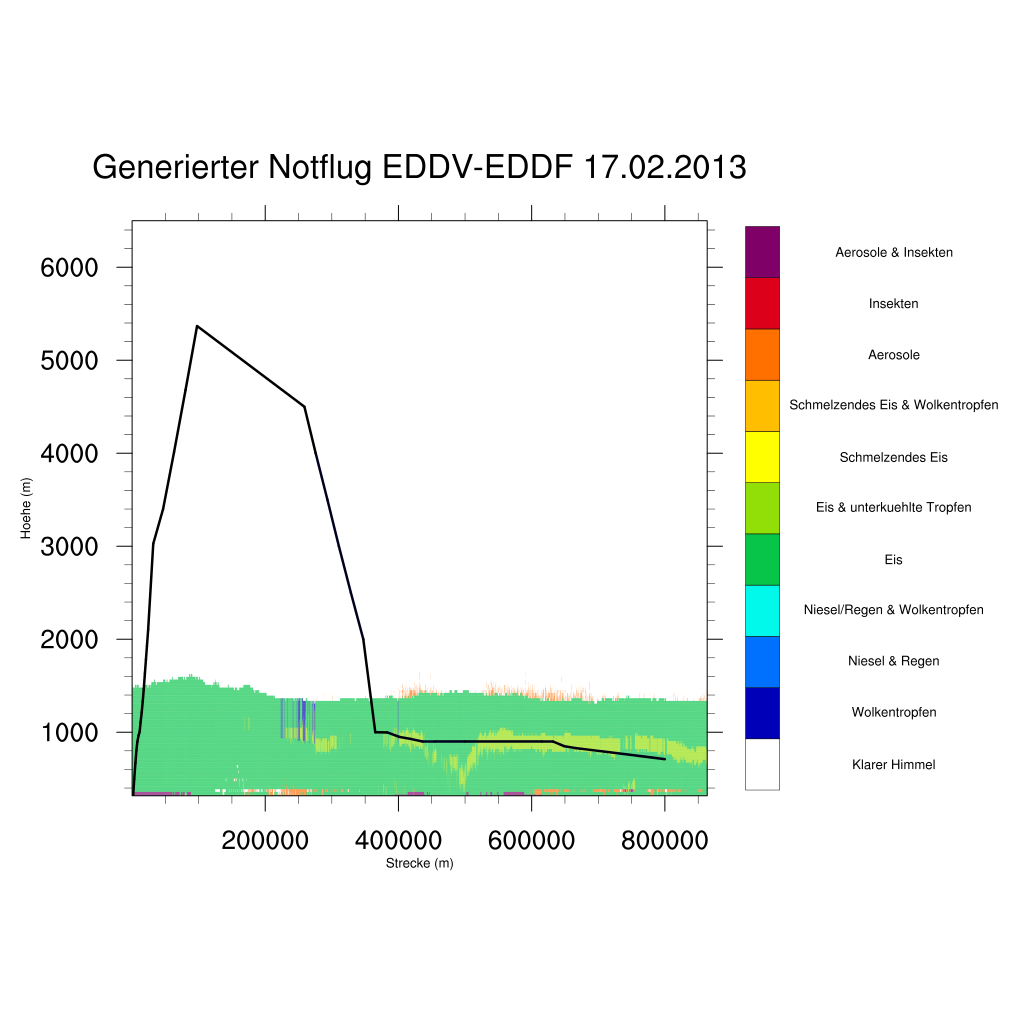
res@tiMainString = "Generierter Notflug EDDV-EDDF 17.02.2013"
res@trGridType = "TriangularMesh"
;**** y-Achsen Ausschnitt ****
res@trYMaxF = 6500
res@trYMinF = 0
;*****************************
;**************************************************
;resources Polyline
;**************************************************
pres = True
pres@gsLineThicknessF = 5.0
pres@gsLineColor = "black" ; color of lines
v=10
s=new(2879,float)
time2=new(2879,float)
time2=time*60*60
s=v*time2
res@sfXArray = s
res@sfYArray = height
contour = gsn_csm_contour(wks,slice,res)
;***************************************************
; Set up resources to attach legend to map.
;***************************************************
line= new(ntime-2,graphic)
do j= 0,ntime-3
if (vi(j).eq.4) then
pres@gsLineColor= (/4/)
else
if(vi(j).eq.2)then
pres@gsLineColor= (/2/)
else
if(vi(j).eq.5)then
pres@gsLineColor= (/5/)
else
if(vi(j).eq.3)then
pres@gsLineColor= (/3/)
end if
end if
end if
end if
line(j) =
gsn_add_polyline(wks,contour,(/x(j),x(j+1)/),(/y(j),y(j+1)/),pres)
;gsn_polyline(wks,(/x(j),x(j+1)/),(/y(j),y(j+1)/),pres)
end do
;line= gsn_add_polyline(wks,contour,x,y,pres)
draw(contour)
frame(wks)
delete(wks)
;end do
end
Quoting Adam Phillips <asphilli@ucar.edu>:
> Hi Katja,
> Did you place your numerous if else statements that define
> gsLineColor within the do loop? When I put "....." in the snippet of
> code I sent you yesterday I assumed you would leave your if else
> statements in there..
>
> If the if else statements were in your script and you are still
> getting black lines please respond to the ncl-talk email list with
> your complete script attached along with a copy of the resulting plot.
> Adam
>
>> On Sep 28, 2013, at 8:41, Katja LohmŁller
>> <lohmueller@muk.uni-hannover.de> wrote:
>>
>> Oh, sorry, I muss have missed tha line while reading. But
>> unfortunately I have to say that it doesn't work either, if I do it
>> this way. The line is still black.
>>
>> Thanks for your help!
>> Katja
>>
>> Quoting Adam Phillips <asphilli@ucar.edu>:
>>
>>> Hi Katja,
>>> Notice that in my original emaiI I put:
>>> line = new(ntime-2,graphic)
>>> above your do loop. That line is necessary to predefine the line array.
>>> Adam
>>>
>>>
>>>> On Sep 28, 2013, at 2:54, Katja LohmŁller
>>>> <lohmueller@muk.uni-hannover.de> wrote:
>>>>
>>>> Dear NCL-talk,
>>>>
>>>> I testest the suggestion below but if I do this way, I get the error
>>>> message that I have to define "line". I tried different versions but
>>>> they all did not work. Which dimension has "line" to be?
>>>>
>>>> Thank you for your help!
>>>> Katja
>>>>
>>>> Quoting Adam Phillips <asphilli@ucar.edu>:
>>>>
>>>> [Hide Quoted Text]
>>>> Hi Katja,
>>>> Try putting gsn_add_polyline in your j do loop and create a new
>>>> graphical array to hold the gsn_add_polyline output:
>>>>
>>>> line = new(ntime-2,graphic)
>>>> do j= 0,ntime-3
>>>> .....
>>>> line(j) =
>>>> gsn_add_polyline(wks,contour,(/x(j),x(j+1)/),(/y(j),y(j+1)/),pres)
>>>> end do
>>>> draw(contour)
>>>> frame(wks)
>>>> delete(wks)
>>>>
>>>> If that does not help please respond to the ncl-talk email list and
>>>> let everyone know..
>>>> Adam
>>>>
>>>> On 09/27/2013 05:38 AM, Katja LohmŁller wrote:
>>>> Dear NCL-talk,
>>>>
>>>> I'm trying to illustrate a figure with a contour plot in the
>>>> background and in the foreground, there should be a line drawn in
>>>> different colors. Now my problem is the function overlay(x,y) doesn't
>>>> work in my case because I'm using the procedure gsn_polyline to create
>>>> the line and an overlay needs a function as argument. If I'm using
>>>> line= gsn_add_polyline, the line is black and that's not what I want
>>>> it to be.
>>>>
>>>> Any suggestions how to solve my problem?
>>>>
>>>> Thanks for your help,
>>>> Katja.
>>>>
>>>>
>>>> The code is as follows:
>>>>
>>>> ;************************************************************
>>>> ; Target Classification 2D
>>>> ;************************************************************
>>>>
>>>> ;************************************************************
>>>> load "$NCARG_ROOT/lib/ncarg/nclscripts/csm/gsn_code.ncl"
>>>> load "$NCARG_ROOT/lib/ncarg/nclscripts/csm/gsn_csm.ncl"
>>>> load "$NCARG_ROOT/lib/ncarg/nclscripts/csm/contributed.ncl"
>>>> ;************************************************************
>>>>
>>>> begin
>>>>
>>>> ;************************************************************
>>>> ;creation of filenames for loop
>>>> ;************************************************************
>>>>
>>>>
>>>>
>>>> ;do j=10,31
>>>>
>>>> day ="17"
>>>> month ="02"
>>>> year ="2013"
>>>> rest ="_lindenberg_classification"
>>>> directory
>>>> ="/localdata/Lohmueller/BA/Daten_Lindenberg/Classification/"
>>>> type ="nc"
>>>>
>>>> filename = directory+year+month+day+rest
>>>>
>>>> ;************************************************************
>>>> ;read in data for contour plot
>>>> ;************************************************************
>>>>
>>>> a = addfile (filename+"."+type , "r")
>>>>
>>>> ;a=addfile("/localdata/Lohmueller/BA/Daten_Lindenberg/Classification/20130101_lindenberg_classification.nc",
>>>> "r")
>>>>
>>>> time=a->time
>>>> tar=a->target_classification
>>>> height=a->height
>>>>
>>>> TAR = tar(height|:,time|:) ;switch atts
>>>>
>>>>
>>>> TAR@units=" "
>>>> TAR@long_name= " "
>>>> time@units=" "
>>>> time@long_name= " "
>>>> height@units=" "
>>>> height@long_name=" "
>>>> height@standard_name=" "
>>>>
>>>> ;************************************************************
>>>> ;read in data for polyline
>>>> ;************************************************************
>>>>
>>>> path = "/localdata/Lohmueller/BA/Amdardaten/Flutra01JanDLH_3_049.txt"
>>>> data = asciiread(path,(/40,3/),"float")
>>>> ntime=40
>>>>
>>>> wks= gsn_open_wks("pdf","Notflug")
>>>>
>>>> ;************************************************************
>>>> ;the data slice
>>>> ;************************************************************
>>>>
>>>> slice=TAR(:,:)
>>>>
>>>> ;**********************************************
>>>> ;polyline parameters
>>>> ;**********************************************
>>>>
>>>> x= new(ntime,float)
>>>> y= new(ntime,float)
>>>> vi= new(ntime,float)
>>>>
>>>> ;**********************************************
>>>> ;put values to variable for polyline
>>>> ;**********************************************
>>>>
>>>> do i=0,ntime-1
>>>> x(i)=data(i,0) ;extract distance
>>>> y(i)=data(i,1) ;extract height
>>>> vi(i)=data(i,2) ;extract Icing
>>>> end do
>>>>
>>>> ;print(x)
>>>> ;print(y)
>>>>
>>>> gsn_define_colormap(wks,"BkBlAqGrYeOrReViWh200")
>>>>
>>>> ;***********************************************
>>>> ;resources contour plot
>>>> ;***********************************************
>>>>
>>>> res = True
>>>> res@gsnDraw = False
>>>> res@gsnFrame = False
>>>>
>>>> res@gsnMaximize = True
>>>> res@gsnPaperOrientation = "landscape"
>>>> res@cnFillOn = True
>>>> ;res@cnCellFillEdgeColor = "black"
>>>> res@cnFillMode = "CellFill"
>>>> res@cnLinesOn = False
>>>> res@cnLineLabelsOn = False
>>>> res@cnLevelSelectionMode = "ManualLevels"
>>>> ; set manual contour levels
>>>>
>>>> res@lbLabelAlignment = "BoxCenters"
>>>> res@cnMinLevelValF = 0.1
>>>> ; set the minimum contour level
>>>> res@cnMaxLevelValF = 9
>>>> ; set the maximum contour level
>>>> res@cnConstFLabelConstantSpacingF = 1
>>>> res@cnFillColors =
>>>> (/201,20,38,54,71,91,102,119,134,156,170/) ; set the
>>>> colors to be used
>>>> res@cnLevelSpacingF = 1
>>>>
>>>> res@tiYAxisString = "Hoehe (m)" ; y axis title
>>>> res@tiXAxisString = "Strecke (m)" ;
>>>> x axis title
>>>> res@tiYAxisFontHeightF = 0.01
>>>> res@tiXAxisFontHeightF = 0.01
>>>>
>>>>
>>>>
>>>> res = True
>>>> ;res@lbAutoManage = True
>>>> res@lbLabelAutoStride = False
>>>> res@lbPerimOn = False
>>>> res@lbOrientation = "Vertical"
>>>> res@lbLabelStride = 1
>>>> res@lbLabelStrings = (/"Klarer
>>>> Himmel","Wolkentropfen","Niesel & Regen","Niesel/Regen &
>>>> Wolkentropfen", "Eis", "Eis & unterkuehlte Tropfen", "Schmelzendes
>>>> Eis", "Schmelzendes Eis & Wolkentropfen","Aerosole",
>>>> "Insekten","Aerosole & Insekten"/)
>>>> res@lbLabelFontHeightF = 0.01
>>>>
>>>>
>>>> res@tiMainString = "Generierter Notflug EDDV-EDDF
>>>> 17.02.2013"
>>>> res@trGridType = "TriangularMesh"
>>>>
>>>>
>>>> ;**** y-Achsen Ausschnitt ****
>>>> res@trYMaxF = 6500
>>>> res@trYMinF = 0
>>>> ;*****************************
>>>>
>>>>
>>>> ;**************************************************
>>>> ;resources Polyline
>>>> ;**************************************************
>>>>
>>>> pres = True
>>>> pres@gsLineThicknessF = 5.0
>>>> pres@gsLineColor = "black" ; color of lines
>>>>
>>>>
>>>>
>>>> v=10
>>>> s=new(2879,float)
>>>> time2=new(2879,float)
>>>> time2=time*60*60
>>>>
>>>> s=v*time2
>>>>
>>>> res@sfXArray = s
>>>> res@sfYArray = height
>>>>
>>>>
>>>>
>>>> contour = gsn_csm_contour(wks,slice,res)
>>>>
>>>> ;***************************************************
>>>> ; Set up resources to attach legend to map.
>>>> ;***************************************************
>>>>
>>>> do j= 0,ntime-3
>>>> if (vi(j).eq.4) then
>>>> pres@gsLineColor= (/4/)
>>>> else
>>>> if(vi(j).eq.2)then
>>>> pres@gsLineColor= (/2/)
>>>> else
>>>> if(vi(j).eq.5)then
>>>> pres@gsLineColor= (/5/)
>>>> else
>>>> if(vi(j).eq.3)then
>>>> pres@gsLineColor= (/3/)
>>>> end if
>>>> end if
>>>> end if
>>>> end if
>>>> gsn_polyline(wks,(/x(j),x(j+1)/),(/y(j),y(j+1)/),pres)
>>>> end do
>>>>
>>>> ;line= gsn_add_polyline(wks,contour,x,y,pres)
>>>>
>>>> draw(contour)
>>>> frame(wks)
>>>>
>>>> delete(wks)
>>>>
>>>> ;end do
>>>>
>>>> end
>>>>
>>>> --
>>>> Katja LohmŁller
>>>> Institut fuer Meteorologie und Klimatologie
>>>> Leibniz Universitaet Hannover
>>>> Herrenhaeuser Str. 2
>>>> 30419 Hannover
>>>>
>>>> Email: lohmueller@muk.uni-hannover.de
>>>> Mobil: 0049 176 61396963
>>>> Buero: 0049 511 762 2396
>>>>
>>>>
>>>> _______________________________________________
>>>> ncl-talk mailing list
>>>> List instructions, subscriber options, unsubscribe:
>>>> http://mailman.ucar.edu/mailman/listinfo/ncl-talk
>>
>>
>>
>> --
>> Katja LohmŁller
>> Institut fuer Meteorologie und Klimatologie
>> Leibniz Universitaet Hannover
>> Herrenhaeuser Str. 2
>> 30419 Hannover
>>
>> Email: lohmueller@muk.uni-hannover.de
>> Mobil: 0049 176 61396963
>> Buero: 0049 511 762 2396
>>
>>
>> _______________________________________________
>> ncl-talk mailing list
>> List instructions, subscriber options, unsubscribe:
>> http://mailman.ucar.edu/mailman/listinfo/ncl-talk
>
-- Katja LohmŁller Institut fuer Meteorologie und Klimatologie Leibniz Universitaet Hannover Herrenhaeuser Str. 2 30419 Hannover Email: lohmueller@muk.uni-hannover.de Mobil: 0049 176 61396963 Buero: 0049 511 762 2396
_______________________________________________
ncl-talk mailing list
List instructions, subscriber options, unsubscribe:
http://mailman.ucar.edu/mailman/listinfo/ncl-talk