Hi, Xin:
I happended to know a little about your problem:
(1)You plot function gsn_csm_contour should have noting to with the map. You
should use gsn_csm_map_contour or something like?
(2)I had this question before and there is a resource deleting with contour
legend. Sorry I only had once and can remember exact name.
(3)never had this quesion.
-----Original Message-----
From: ncl-talk-request@ucar.edu
Sent: Friday, October 04, 2013 2:32 PM
To: ncl-talk@ucar.edu
Subject: ncl-talk Digest, Vol 119, Issue 6
Send ncl-talk mailing list submissions to
ncl-talk@ucar.edu
To subscribe or unsubscribe via the World Wide Web, visit
http://mailman.ucar.edu/mailman/listinfo/ncl-talk
or, via email, send a message with subject or body 'help' to
ncl-talk-request@ucar.edu
You can reach the person managing the list at
ncl-talk-owner@ucar.edu
When replying, please edit your Subject line so it is more specific
than "Re: Contents of ncl-talk digest..."
Today's Topics:
1. Panel plots of contour map, overlay with contours (Xin Xi)
----------------------------------------------------------------------
Message: 1
Date: Fri, 4 Oct 2013 15:32:25 -0400
From: Xin Xi <xxi@gatech.edu>
Subject: Panel plots of contour map, overlay with contours
To: "ncl-talk@ucar.edu USERS" <ncl-talk@ucar.edu>
Message-ID:
<CAM5oqAE7hJkp6=ORfTuUiTKcWZJyXZK0Py7LOQk-X-kUPAjxMg@mail.gmail.com>
Content-Type: text/plain; charset="iso-8859-1"
Hi,
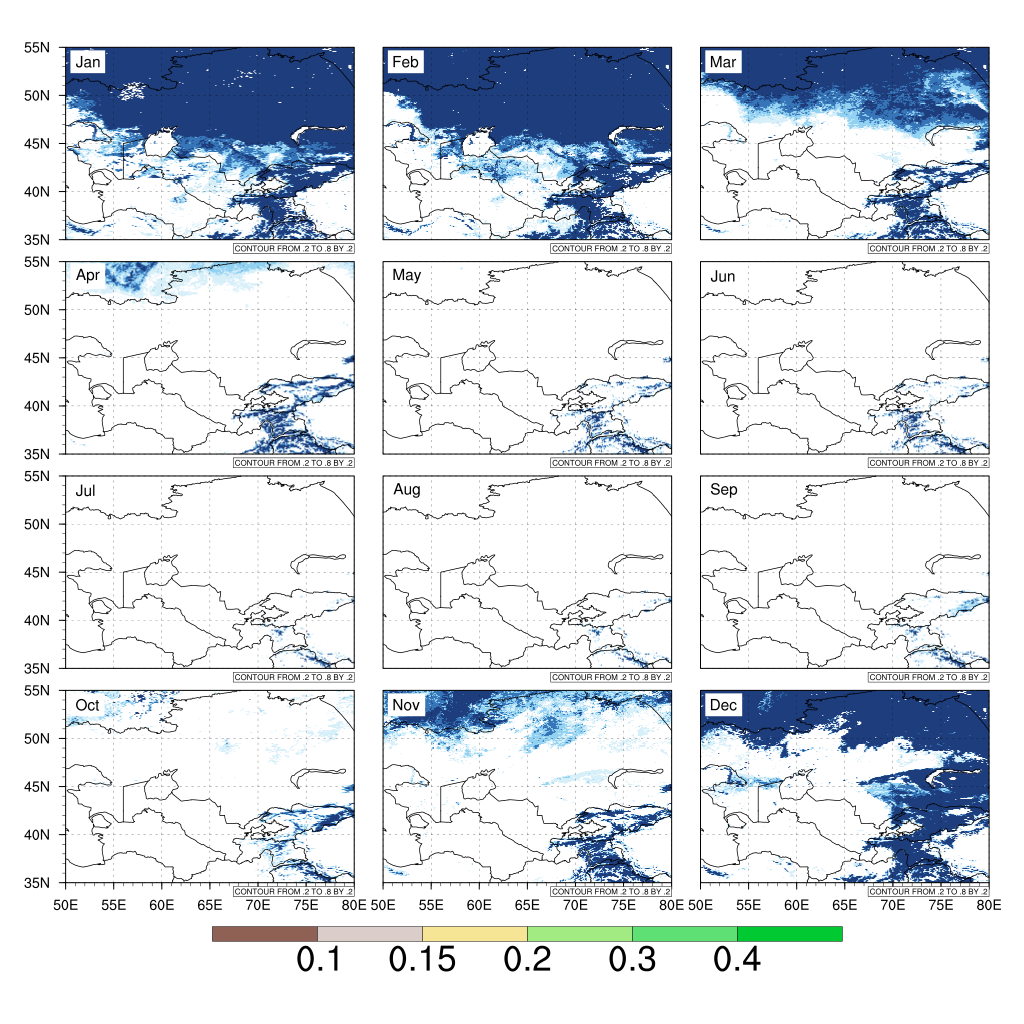
I am trying to make a panel plot of two data fields of the same dimensions:
time x lat x lon. I want to show one data field overlay above the other.
Here is the part of script for plotting.
My questions are
1. why does the base map not show?
2. how do I remove the text string "CONTOUR FROM ....."?
3. how do I draw the second labelbar for the contour?
Thanks!
;-----------------------------------
cmap = (/ (/255, 255, 255/) ,\
(/ 0, 0, 0/) ,\
(/143, 97, 84 /) ,\ ;0
(/219, 205, 202/) ,\ ;1
(/246, 229, 149/) ,\ ;2
(/162, 235, 130/) ,\ ;3
(/94, 224, 116/) ,\ ;4
(/0, 201, 50 /) ,\ ;5
(/255, 255, 255/) ,\ ;6
(/215, 239, 249/) ,\ ;7
(/145, 209, 242/) ,\ ;8
(/55, 117, 185/) ,\ ;9
(/30, 61, 124/) /)/255. ;10
;---------------------------------------
print("create plots")
res1 = True
res1@gsnDraw = False
res1@gsnFrame = False
res1@gsnMaximize = False
res1@cnFillOn = True
res1@cnLinesOn = False
res1@cnLineLabelsOn = False
res1@cnFillMode = "RasterFill"
res1@cnLevelSelectionMode = "ExplicitLevels"
res1@gsnAddCyclic = False
res1@lbLabelBarOn = False
res1@tmXTOn = False
res1@tmYROn = False
res1@tmXBOn = True
res1@tmYLOn = True
res1@tmXBValues = ispan(toint(lonL),toint(lonR),5)
res1@tmXBLabels = res1@tmXBValues+"E"
res1@tmXBMinorValues = ispan(toint(lonL),toint(lonR),1)
res1@tmXBLabelFontHeightF = 0.025
res1@tmYLLabelFontHeightF = res1@tmXBLabelFontHeightF
res2 = res1
res1@mpLimitMode = "LatLon"
res1@mpMinLatF = latS
res1@mpMinLonF = lonL
res1@mpMaxLatF = latN
res1@mpMaxLonF = lonR
res1@mpFillOn = False
res1@mpOutlineOn = True
res1@mpDataBaseVersion = "MediumRes"
res1@mpOutlineBoundarySets = "AllBoundaries"
res1@mpNationalLineThicknessF = 1.5
res1@mpGeophysicalLineThicknessF = 1.5
res1@mpGridAndLimbOn = True
res1@mpGridSpacingF = 5.0
res1@mpGridLineThicknessF = 0.5
res1@mpGridLineDashPattern = 2
res1@cnLevels = (/.1, .15, .2, .3, .4/)
res1@cnFillColors = (/2, 3, 4, 5, 6, 7/)
type = "newpng"
outfile = "Figure_1"
wks = gsn_open_wks(type,outfile)
gsn_define_colormap(wks,cmap)
plts1 = new(nmon,graphic)
do i = 0, nmon-1
if (i.le.nmon-4) then
res1@tmXBOn = False
else
res1@tmXBOn = True
end if
if (i%3.eq.0) then
res1@tmYLOn = True
else
res1@tmYLOn = False
end if
plts1(i)=gsn_csm_contour_map_ce(wks,ndvi_dom(i,:,:),res1)
end do
res2@tmXBOn = False
res2@tmYLOn = False
res2@cnLevels = (/.2, .4, .6, .8/)
res2@cnFillColors = (/-1, 9, 10, 11, 12/)
rtxt = True
rtxt@txJust = "CenterLeft"
rtxt@txFontHeightF = 0.035
rtxt@PerimOn = False
rtxt@txBackgroundFillColor= "white"
plts2 = new(nmon,graphic)
txts = new(nmon,graphic)
do i = 0, nmon-1
plts2(i)= gsn_csm_contour(wks,snow_dom(i,:,:),res2)
txts(i) = gsn_add_text(wks,plts2(i),monstr(i),50.5,53.5,rtxt)
overlay(plts1(i),plts2(i))
end do
resP = True
resP@gsnMaximize = True
resP@gsnPanelLabelBar = True
resP@gsnPanelCenter = False
resP@gsnFrame = False
resP@pmLabelBarOrthogonalPosF = -0.01
resP@gsnPanelBottom = 0.05
resP@gsnPanelTop = 0.98
resP@gsnPanelLeft = 0.05
resP@gsnPanelRight = 0.98
resP@gsnPanelScalePlotIndex = 4
resP@gsnPanelXWhiteSpacePercent = 5
resP@gsnPanelYWhiteSpacePercent = 2
gsn_panel(wks,plts1,(/4,3/),resP)
frame(wks)
--
*Xin Xi
School of Earth and Atmospheric Sciences
Georgia Institute of Technology
311 Ferst Drive, Atlanta, GA 30332-0340*
-------------- next part --------------
An HTML attachment was scrubbed...
URL:
http://mailman.ucar.edu/pipermail/ncl-talk/attachments/20131004/a54d385a/attachment.html
-------------- next part --------------
A non-text attachment was scrubbed...
Name: Figure_1.png
Type: image/png
Size: 534213 bytes
Desc: not available
Url :
http://mailman.ucar.edu/pipermail/ncl-talk/attachments/20131004/a54d385a/attachment.png
------------------------------
_______________________________________________
ncl-talk mailing list
ncl-talk@ucar.edu
http://mailman.ucar.edu/mailman/listinfo/ncl-talk
End of ncl-talk Digest, Vol 119, Issue 6
****************************************
_______________________________________________
ncl-talk mailing list
List instructions, subscriber options, unsubscribe:
http://mailman.ucar.edu/mailman/listinfo/ncl-talk
Received on Fri Oct 4 13:41:19 2013
This archive was generated by hypermail 2.1.8 : Fri Oct 04 2013 - 16:45:17 MDT