Date: Fri Oct 04 2013 - 13:32:25 MDT
Hi,
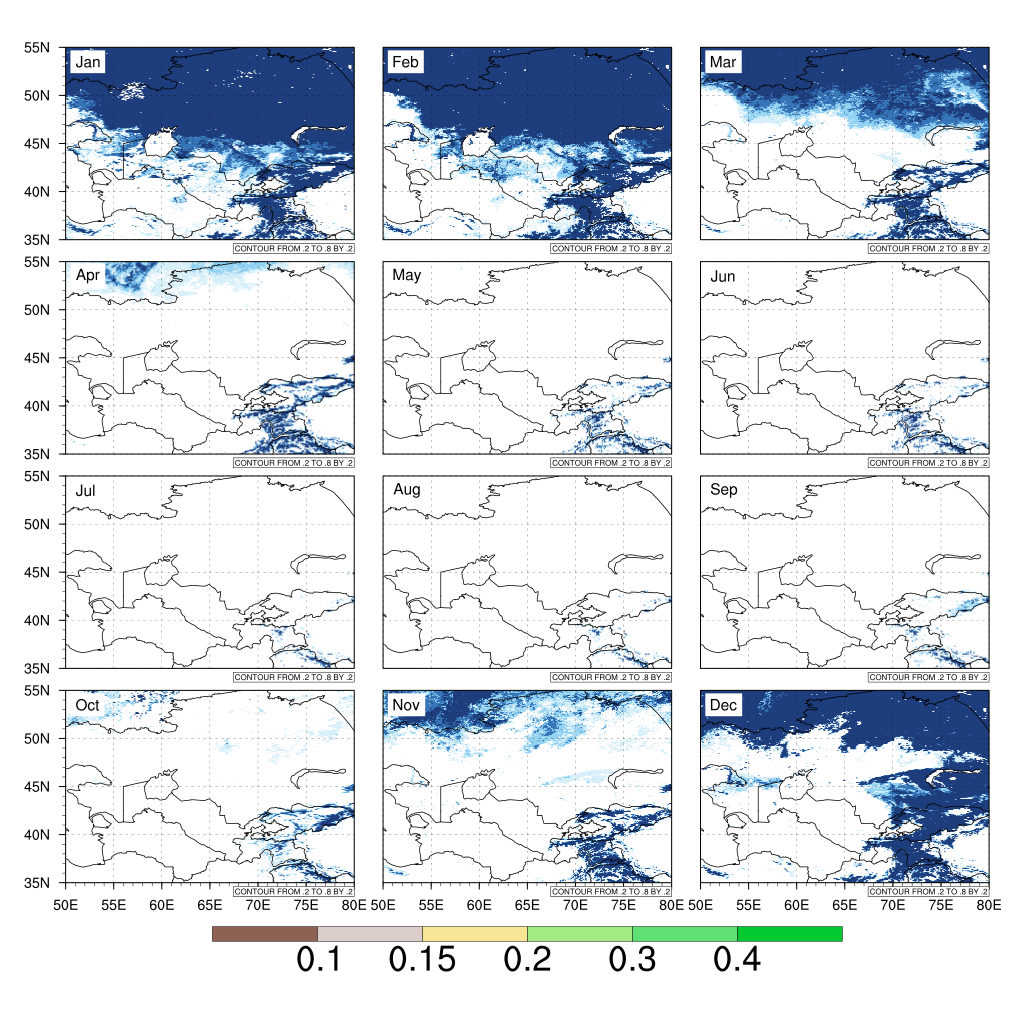
I am trying to make a panel plot of two data fields of the same dimensions:
time x lat x lon. I want to show one data field overlay above the other.
Here is the part of script for plotting.
My questions are
1. why does the base map not show?
2. how do I remove the text string "CONTOUR FROM ....."?
3. how do I draw the second labelbar for the contour?
Thanks!
;-----------------------------------
cmap = (/ (/255, 255, 255/) ,\
(/ 0, 0, 0/) ,\
(/143, 97, 84 /) ,\ ;0
(/219, 205, 202/) ,\ ;1
(/246, 229, 149/) ,\ ;2
(/162, 235, 130/) ,\ ;3
(/94, 224, 116/) ,\ ;4
(/0, 201, 50 /) ,\ ;5
(/255, 255, 255/) ,\ ;6
(/215, 239, 249/) ,\ ;7
(/145, 209, 242/) ,\ ;8
(/55, 117, 185/) ,\ ;9
(/30, 61, 124/) /)/255. ;10
;---------------------------------------
print("create plots")
res1 = True
res1@gsnDraw = False
res1@gsnFrame = False
res1@gsnMaximize = False
res1@cnFillOn = True
res1@cnLinesOn = False
res1@cnLineLabelsOn = False
res1@cnFillMode = "RasterFill"
res1@cnLevelSelectionMode = "ExplicitLevels"
res1@gsnAddCyclic = False
res1@lbLabelBarOn = False
res1@tmXTOn = False
res1@tmYROn = False
res1@tmXBOn = True
res1@tmYLOn = True
res1@tmXBValues = ispan(toint(lonL),toint(lonR),5)
res1@tmXBLabels = res1@tmXBValues+"E"
res1@tmXBMinorValues = ispan(toint(lonL),toint(lonR),1)
res1@tmXBLabelFontHeightF = 0.025
res1@tmYLLabelFontHeightF = res1@tmXBLabelFontHeightF
res2 = res1
res1@mpLimitMode = "LatLon"
res1@mpMinLatF = latS
res1@mpMinLonF = lonL
res1@mpMaxLatF = latN
res1@mpMaxLonF = lonR
res1@mpFillOn = False
res1@mpOutlineOn = True
res1@mpDataBaseVersion = "MediumRes"
res1@mpOutlineBoundarySets = "AllBoundaries"
res1@mpNationalLineThicknessF = 1.5
res1@mpGeophysicalLineThicknessF = 1.5
res1@mpGridAndLimbOn = True
res1@mpGridSpacingF = 5.0
res1@mpGridLineThicknessF = 0.5
res1@mpGridLineDashPattern = 2
res1@cnLevels = (/.1, .15, .2, .3, .4/)
res1@cnFillColors = (/2, 3, 4, 5, 6, 7/)
type = "newpng"
outfile = "Figure_1"
wks = gsn_open_wks(type,outfile)
gsn_define_colormap(wks,cmap)
plts1 = new(nmon,graphic)
do i = 0, nmon-1
if (i.le.nmon-4) then
res1@tmXBOn = False
else
res1@tmXBOn = True
end if
if (i%3.eq.0) then
res1@tmYLOn = True
else
res1@tmYLOn = False
end if
plts1(i)=gsn_csm_contour_map_ce(wks,ndvi_dom(i,:,:),res1)
end do
res2@tmXBOn = False
res2@tmYLOn = False
res2@cnLevels = (/.2, .4, .6, .8/)
res2@cnFillColors = (/-1, 9, 10, 11, 12/)
rtxt = True
rtxt@txJust = "CenterLeft"
rtxt@txFontHeightF = 0.035
rtxt@PerimOn = False
rtxt@txBackgroundFillColor= "white"
plts2 = new(nmon,graphic)
txts = new(nmon,graphic)
do i = 0, nmon-1
plts2(i)= gsn_csm_contour(wks,snow_dom(i,:,:),res2)
txts(i) = gsn_add_text(wks,plts2(i),monstr(i),50.5,53.5,rtxt)
overlay(plts1(i),plts2(i))
end do
resP = True
resP@gsnMaximize = True
resP@gsnPanelLabelBar = True
resP@gsnPanelCenter = False
resP@gsnFrame = False
resP@pmLabelBarOrthogonalPosF = -0.01
resP@gsnPanelBottom = 0.05
resP@gsnPanelTop = 0.98
resP@gsnPanelLeft = 0.05
resP@gsnPanelRight = 0.98
resP@gsnPanelScalePlotIndex = 4
resP@gsnPanelXWhiteSpacePercent = 5
resP@gsnPanelYWhiteSpacePercent = 2
gsn_panel(wks,plts1,(/4,3/),resP)
frame(wks)
--
*Xin Xi
School of Earth and Atmospheric Sciences
Georgia Institute of Technology
311 Ferst Drive, Atlanta, GA 30332-0340*
_______________________________________________
ncl-talk mailing list
List instructions, subscriber options, unsubscribe:
http://mailman.ucar.edu/mailman/listinfo/ncl-talk