Date: Wed Oct 09 2013 - 16:42:25 MDT
Dear NCL members,
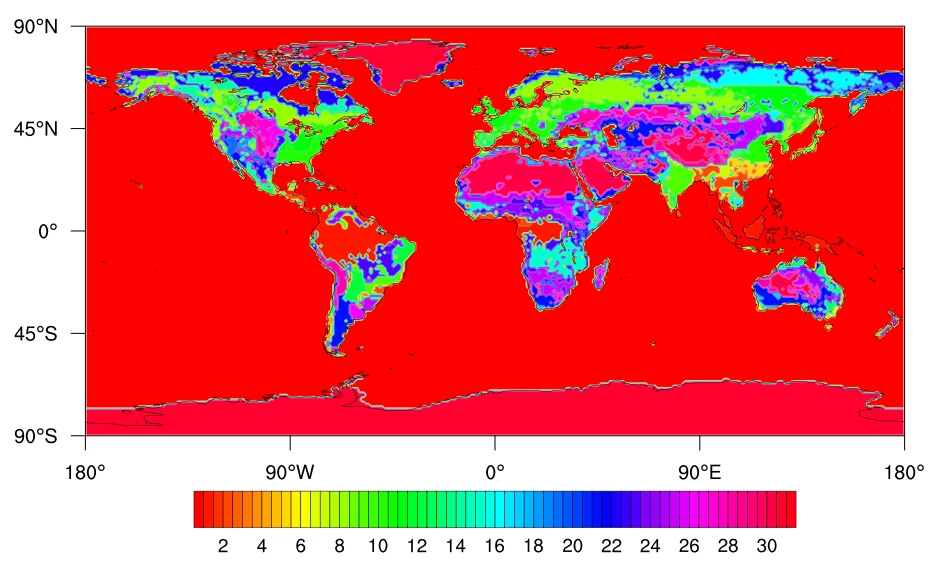
I was plotting global vegetation types. There are 31 types on the lands, from 1 to 31 (byte), with "0" as missing values for ocean area.
I tried many times to leave ocean area as white/blank but failed. Is there any way to do this?
Second, I would like to devide the legend into exactly 31 to match the vegetation types but it seemed impossible. Am I correct?
I attached the figure I got and code below it. And will upload my data to the FTP.
I would appreciate if anyone has suggestions for me.
Thanks,
Lifen
;************************************************
load "$NCARG_ROOT/lib/ncarg/nclscripts/csm/gsn_code.ncl"
load "$NCARG_ROOT/lib/ncarg/nclscripts/csm/gsn_csm.ncl"
load "$NCARG_ROOT/lib/ncarg/nclscripts/csm/contributed.ncl"
;************************************************
begin
;************************************************
; open file and read in data
;************************************************
in = addfile("vegtype.nc","r")
t = in->matthews0
t@_FillValue = integertobyte(0)
t@missing_value = t@_FillValue
;t = where(t .eq. 0, t@_FillValue, t)
printVarSummary(t)
;************************************************
; create plot
;************************************************
wks = gsn_open_wks("png" ,"Plot_vegtype") ;
gsn_define_colormap(wks,"matlab_hsv") ; choose colormap
res = True ; plot mods desired
res@cnFillOn = True ; turn on color fill
res@cnLinesOn = False ; turn off contour lines
res@cnLevelSpacingF = 0.5 ; contour spacing
;---This resource not needed in NCL V6.1.0
res@gsnSpreadColors = True ; use full range of color map
res@lbLabelStride = 1
res@pmTickMarkDisplayMode = "Always"; use NCL default lat/lon labels
res@gsnAddCyclic = False ; data already has cyclic point
; this must also be set for any zoom
; note that the gsn_csm_*map_ce templates automatically set
; res@mpLimitMode="LatLon" for you. If you are plotting a different projection,
; you may have to set this resource.
res@mpMinLatF = -90 ; range to zoom in on
res@mpMaxLatF = 90
res@mpMinLonF = -180
res@mpMaxLonF = 180
res@cnLevelSelectionMode = "ManualLevels"
res@cnMinLevelValF = 1
res@cnMaxLevelValF = 31
plot = gsn_csm_contour_map_ce(wks,t({-90:90},{-180:180}), res)
;************************************************
end
_______________________________________________
ncl-talk mailing list
List instructions, subscriber options, unsubscribe:
http://mailman.ucar.edu/mailman/listinfo/ncl-talk