Date: Thu Oct 17 2013 - 00:40:09 MDT
Dear All,
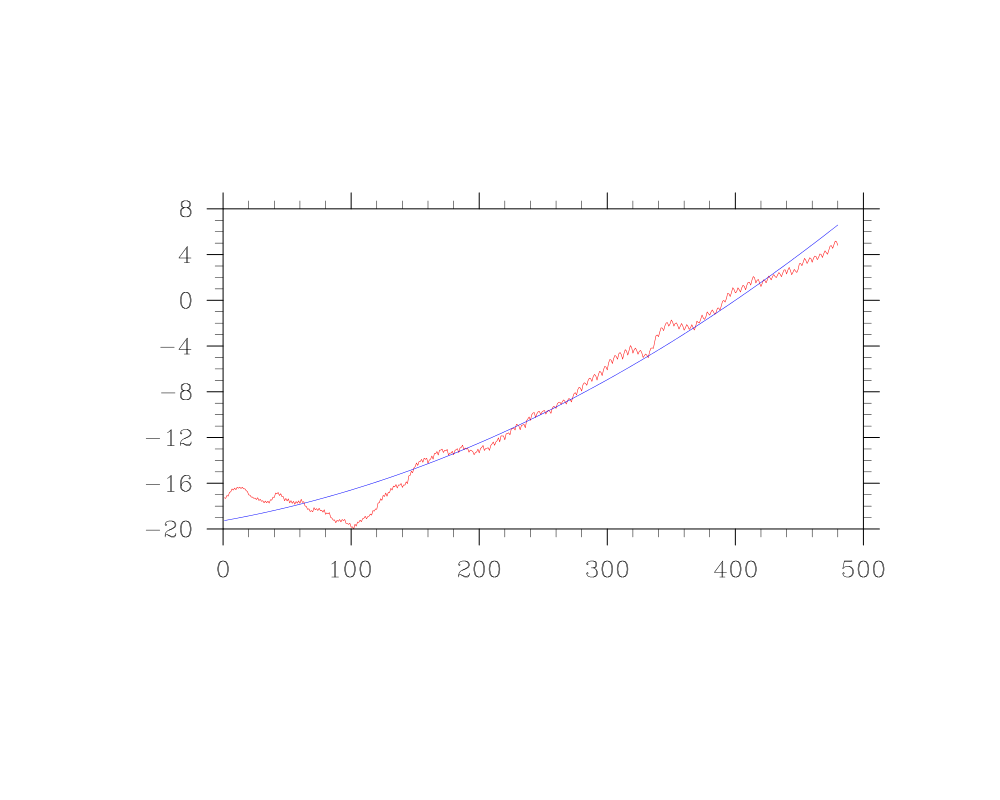
I have a timeseries for a 480 timesteps. I want to create a polynomial that
would capture the major variability of the timeseries, but mine is fitting
very smoothly.
I followed
* http://www.ncl.ucar.edu/Document/Functions/Built-in/lspoly.shtml and
using this, the polynomial is fitting smoothly without showing the major
variability of the data.
*http://www.ncl.ucar.edu/Applications/Scripts/interp1d_1.ncl, I can fit the
curve showing the variability but could not create the polynomial function
of same dimension.
Is it possible to do using NCL?
Thanks for your time and help!
Bithi
For 1st approach the code is like this:
;*************test time series***********
ts_rev=SAT(y|:,x|:)
printVarSummary(ts_rev) ; dataset 32*480
printMinMax(ts_rev,True)
;****************************
;create polynomial function
;****************************
xi= ispan(1,480,1)
do i=0,31
t=new((/480/), "float")
t = ts_rev(i,:)
printVarSummary(t)
n = 3
c = lspoly(xi,t, 1, n)
printVarSummary(c)
print(c)
Y = c(0) + c(1)*xi + c(2)*xi^2 ;Polynomial
printVarSummary(Y)
.
.
And For plot, I did like the follows to overlay two plots:
xy_orig = gsn_csm_xy(wks,xi,t,res)
xy_interp = gsn_csm_xy(wks,xi,Y,sres)
overlay(xy_orig,xy_interp)
draw(xy_orig)
-.-
Bithi De
Graduate Student , Research Assistant
International Arctic Research Center , University of Alaska Fairbanks
Fairbanks , Alaska -99775
USA
_______________________________________________
ncl-talk mailing list
List instructions, subscriber options, unsubscribe:
http://mailman.ucar.edu/mailman/listinfo/ncl-talk