Date: Tue Nov 12 2013 - 11:23:23 MST
Hello,
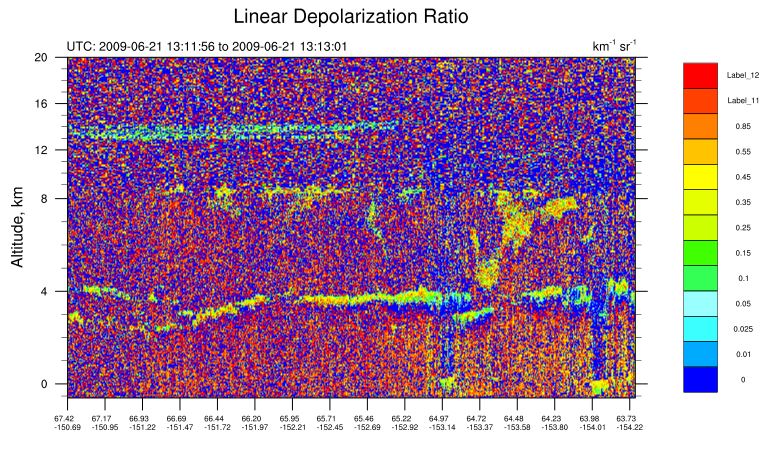
I am trying to set a boundary for my labels. I want any value appearing
after 0.85 to be the highest color (be it red or orange). However, after
0.85, there are a couple of colors, and they aren't labeled (appearing as
"Label_12" and "Label_11"). This occurs even though I have established
explicitly the range beforehand (below).
res@cnLevels = (/0.0,0,01,0.025,0.05,0.1,0.15,0.25,0.35,0.45, 0.55,0.85/)
res@lbLabelStrings =
(/0.0,0.01,0.025,0.05,0.1,0.15,0.25,0.35,0.45,0.55,0.85/)
How can I get rid of "Label_12", "Label_11"? Am I missing a special label
resource? I want anything beyond 0.85 to be given just one color.
I have attached a plot. My code is below. Thank you much.
load "$NCARG_ROOT/lib/ncarg/nclscripts/csm/gsn_code.ncl"
load "$NCARG_ROOT/lib/ncarg/nclscripts/csm/gsn_csm.ncl"
load "$NCARG_ROOT/lib/ncarg/nclscripts/csm/contributed.ncl"
load "$NCARG_ROOT/lib/ncarg/nclscripts/csm/shea_util.ncl"
load "$NCARG_ROOT/lib/ncarg/nclscripts/contrib/ut_string.ncl"
;**************************************************
begin
;----------------------------------------------
; OPEN CALIPSO FILE AND WORKSTATION
;----------------------------------------------
fili = systemfunc("ls
/import/archive/u1/uaf/jmmadden/WILDFIRE2009/CALIPSOdata/SUBSETS/CAL_LID*")
nfil = dimsizes(fili) ; nfil = number of CALIPSO files, use for loop.
f = addfiles(fili + ".hdf","r")
wks = gsn_open_wks("x11","ldr")
;wks = gsn_open_wks("pdf","ldr")
;----------------------------------------------
; CREATE A LOOP TO READ EACH FILE SEQUENTIALLY
;----------------------------------------------
do ifile = 0, nfil-1
;----------------------------------------------
; TO GET CALIPSO DEPOLARIZATION, TAKE THE RATIO OF PERPENDICULAR
ATTENUATED BACKSCATTER OVER TOTAL ATTENUATED BACKSCATTER, BOTH AT 532 NM
;----------------------------------------------
;----------------------------------------------
; READ CALIPSO DATA
;----------------------------------------------
tot = f[ifile]->Total_Attenuated_Backscatter_532
perp = f[ifile]->Perpendicular_Attenuated_Backscatter_532
paral = tot - perp
; watch out for division by zero
paral = where(paral.ne.0, paral, paral@_FillValue)
; linear depolarization ratio = perpendicular backscatter / parallel
backscatter
back1 = perp/paral
back1!0 = "first"
back1!1 = "second"
dims = getvardims(back1)
; Reverse the vertical array
back1 = back1(:,::-1)
; Reorder using string dimension names
back = back1(second|:,first|:)
; back = back1($dims(1)$|:,$dims(0)$|:)
back@_FillValue = -9999
back@units = "km~S~-1~NN~ sr~S~-1~NN~"
; Get the lat and lon arrays for the x-axis
lat = (/f[ifile]->Latitude/)
lon = (/f[ifile]->Longitude/)
xlabel = sprintf("%.2f",lat)+"~C~"+sprintf("%.2f",lon)
; Work with the time fields to get a valid time string
time = (/f[ifile]->Profile_Time/)
time@units = "seconds since 1993-01-01 00:00"
tstring = ut_string(time(:,0), "%Y-%N-%D %H:%M:%S")
; Set stride intervals for x-axis
stride = dimsizes(tstring)/15
; Get the altitude values.
hgt = asciiread("lidar_altitudes.txt", -1, "float")
hgt = hgt(::-1) ; Reverse this array too
hgt!0 = "hgt"
hgt@long_name = "Altitude, km"
hgt@units = "km"
printVarSummary(hgt)
; Assign new dimensions and attributes
back!0 = "hgt"
back&hgt = hgt
xcoord = ispan(0,dimsizes(lat(:,0)) - 1,1)
back!1 = "xcoord"
back&xcoord = xcoord
;*************************
; create plot
;*************************
setvalues NhlGetWorkspaceObjectId()
"wsMaximumSize": 300000000
end setvalues
colorMap = read_colormap_file("BlAqGrYeOrRe")
res = True
res@cnFillOn = True ; color plot desired
res@cnLinesOn = False
res@cnFillPalette = colorMap
res@cnSpanFillPalette = True
res@cnRasterModeOn = True
res@gsnAddCyclic = False
res@gsnMaximize = True
res@gsnLeftString = "UTC: "+tstring(0)+" to
"+tstring(dimsizes(tstring)-1)
res@tiMainString = "Linear Depolarization Ratio"
res@tiMainFontHeightF = 0.025
res@tiYAxisFontHeightF = 0.02
res@cnLevelSelectionMode = "ExplicitLevels"
res@cnLevels = (/0.0,0,01,0.025,0.05,0.1,0.15,0.25,0.35,0.45, 0.55,0.85/)
res@lbLabelStrings =
(/0.0,0.01,0.025,0.05,0.1,0.15,0.25,0.35,0.45,0.55,0.85/)
res@lbLabelAlignment = "BoxCenters"
res@tmXTOn = False
res@tmXBMode = "Explicit"
res@tmXBValues = xcoord(::stride)
res@tmXBLabels = xlabel(::stride,0)
res@tmXBLabelFontHeightF = 0.01
res@trYMaxF = 20
res@lbLabelFontHeightF = 0.01
res@lbLabelAngleF = 0.0
res@lbOrientation = "vertical"
res@vpWidthF = 1.0
res@gsnDraw = True
res@gsnFrame = False
plot = gsn_csm_contour(wks,back,res)
frame(wks)
delete([/tot,perp,back,back1,lat,lon,xlabel,time,tstring,xcoord/])
end do
end
--
*Mike Madden*
*Graduate Research Assistant *
*Department of Atmospheric Sciences *
*University of Alaska Fairbanks*
*IARC 338N*
*Office:  (907) 474-7618*
*Cell: (417)
439-2830---------------------------------------------------------------------"Buy
the ticket, take the ride."  Hunter S. Thompson*
_______________________________________________
ncl-talk mailing list
List instructions, subscriber options, unsubscribe:
http://mailman.ucar.edu/mailman/listinfo/ncl-talk