Hi All
I am trying to correlate the first principal component or EOF 1 with global SST's
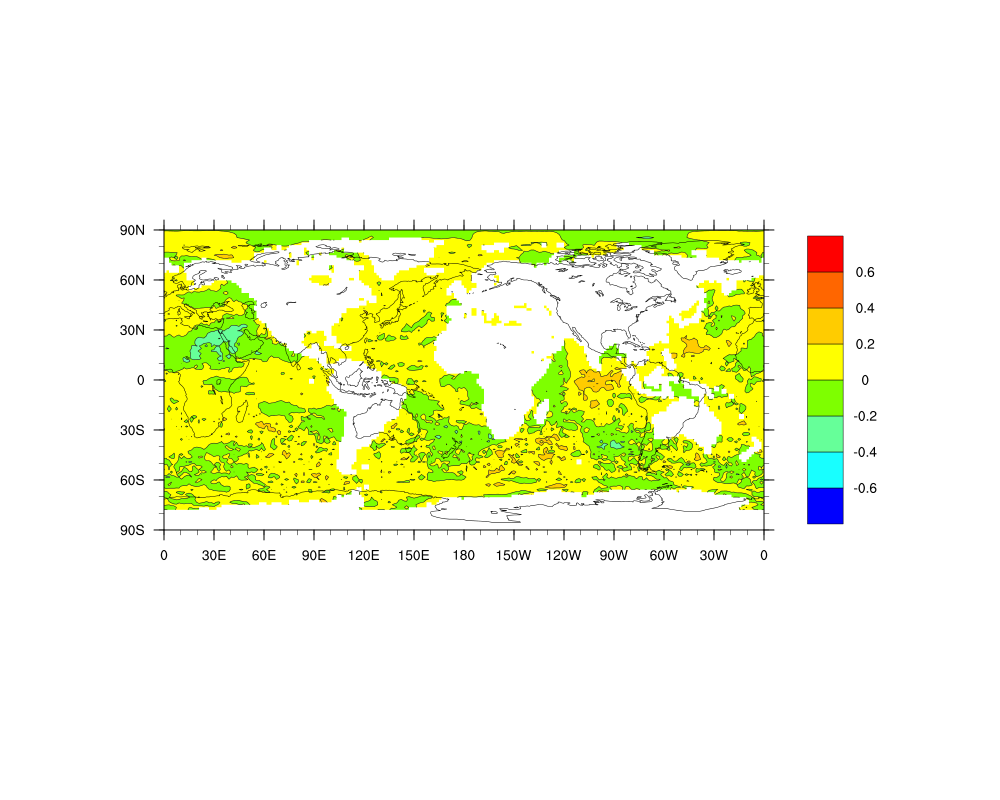
I have created a script in which to do this but am not quite getting it right as it is supposed to look like this
[corr Dec-Feb monthly PC1 of CMAP precipitation / s.d. \with Dec-Feb monthly HadISST1 SST 1979:2008 p<10%]
But I am getting nothing of the sort (attached) and I am trying to figure out where my problem lies.
My code is attached below and if anyone can see something wrong with this please any advice is very welcome.
Many thanks for your help in this matter.
Kind Regards
Melissa
; ==============================================================
; eof_1.ncl
;
; Concepts illustrated:
; - Calculating EOFs
; - Using coordinate subscripting to read a specified geographical region
; - Rearranging longitude data to span -180 to 180
; - Calculating symmetric contour intervals
; - Drawing filled bars above and below a given reference line
; - Drawing subtitles at the top of a plot
;
; ==============================================================
; Calculate EOFs of the Sea Level Pressure over the North Atlantic.
; ==============================================================
; The slp.mon.mean file can be downloaded from:
; http://www.esrl.noaa.gov/psd/data/gridded/data.ncep.reanalysis.surface.html
; ==============================================================
load "$NCARG_ROOT/lib/ncarg/nclscripts/csm/gsn_code.ncl"
load "$NCARG_ROOT/lib/ncarg/nclscripts/csm/gsn_csm.ncl"
load "$NCARG_ROOT/lib/ncarg/nclscripts/csm/contributed.ncl"
begin
; ==============================================================
; User defined parameters that specify region of globe and
; ==============================================================
latS = -40.
latN = 0.
lonL = 10.
lonR = 60.
yrStrt = 1979
yrLast = 2009
season = "DJF" ; choose Dec-Jan-Feb seasonal mean
neof = 1 ; number of EOFs
optEOF = True
optEOF@jopt<mailto:optEOF@jopt> = 0 ; This is the default; most commonly used; no need to specify.
;;optEOF@jopt = 1 ; **only** if the correlation EOF is desired
optETS = False
; ==============================================================
; Open the file: Read only the user specified period
; ==============================================================
f = addfile ("/mnt/nfs2/geog/ml382/melphd/global/cmap_eof1.nc", "r")
lat = f->lat
TIME = f->time
YYYY = cd_calendar(TIME,-1)/100 ; entire file
iYYYY = ind(YYYY.ge.yrStrt .and. YYYY.le.yrLast)
PR = f->precip(iYYYY,:,:)
printVarSummary(PR)
; variable overview
s = addfile ("/mnt/nfs2/geog/ml382/melphd/global/oisst_global1.nc", "r")
sst = s->sst
;lat = s->lat
;lon = s->lon
;TIME = s->time
printVarSummary(sst) ; variable overview
sst1 =sst(:,:,:)
; ==============================================================
; compute desired global seasonal mean: month_to_season (contributed.ncl)
; ==============================================================
;PR = month_to_season (precip, season)
nyrs = dimsizes(PR&time)
;printVarSummary(PR)
; =================================================================
; normalize data at each gridpoint by local standard deviation at each grid pt
; =================================================================
PR = dim_standardize_n(PR,1,0)
; =================================================================
; Reorder (lat,lon,time) the *weighted* input data
; Access the area of interest via coordinate subscripting
; =================================================================
x = PR({lat|latS:latN},{lon|lonL:lonR},time|:)
eof = eofunc_Wrap(x, neof, optEOF)
eof_ts = eofunc_ts_Wrap (x, eof, optETS)
printVarSummary( eof ) ; examine EOF variables
printVarSummary( eof_ts )
print(eof_ts)
;Correlations of EOF1 and global sst anomalies
y = sst1(lat|:,lon|:,time|:)
y&lat@units<mailto:y&lat@units> = "degrees_north"
y&lon@units<mailto:y&lon@units> = "degrees_east"
ccr = escorc(eof_ts, y)
printVarSummary(ccr)
print(ccr)
ccr!0 = "lat" ; name dimensions
ccr!1 = "lon"
;ccr&lat@units = "degrees_north" ; assign coordinate values and
;ccr&lon@units = "degrees_east" ; units attributes
ccr1=ccr(0,:,:)
print(ccr1)
yyyymm = cd_calendar(eof_ts&time,-2)/100
;;yrfrac = yyyymm_to_yyyyfrac(yyyymm, 0.0); not used here
;============================================================
; PLOT
;============================================================
;*******************************************
; global plot
;*******************************************
wks = gsn_open_wks("X11","globalmap")
gsn_define_colormap(wks,"gui_default") ; choose colormap
rescn = True
rescn@cnFillOn<mailto:rescn@cnFillOn> = True
;rescn@gsnDraw = False ; don't draw
;rescn@gsnFrame = False ; don't advance frame
rescn@cnLevelSelectionMode<mailto:rescn@cnLevelSelectionMode> = "ManualLevels" ; set manual contour levels
rescn@cnMinLevelValF<mailto:rescn@cnMinLevelValF> = -0.6 ; set min contour level
rescn@cnMaxLevelValF<mailto:rescn@cnMaxLevelValF> = 0.6 ; set max contour level
rescn@cnLevelSpacingF<mailto:rescn@cnLevelSpacingF> = 0.2 ; set contour spacing
rescn@lbOrientation<mailto:rescn@lbOrientation> = "Vertical" ; vertical label bar
;---This resource defaults to True in NCL V6.1.0
rescn@lbLabelAutoStride<mailto:rescn@lbLabelAutoStride> = True ; optimal label stride
rescn@gsnSpreadColors<mailto:rescn@gsnSpreadColors> = True ; use full range of colors
rescn@mpCenterLonF<mailto:rescn@mpCenterLonF> = 180. ; center plot at 180
rescn@gsnAddCyclic<mailto:rescn@gsnAddCyclic> = True
plot = gsn_csm_contour_map(wks,ccr1,rescn)
end
_______________________________________________
ncl-talk mailing list
List instructions, subscriber options, unsubscribe:
http://mailman.ucar.edu/mailman/listinfo/ncl-talk
This archive was generated by hypermail 2.1.8 : Fri Nov 22 2013 - 09:36:32 MST