Date: Thu Nov 28 2013 - 20:30:17 MST
I am sorry that I forgot to attach the figure in my previous e-mail.
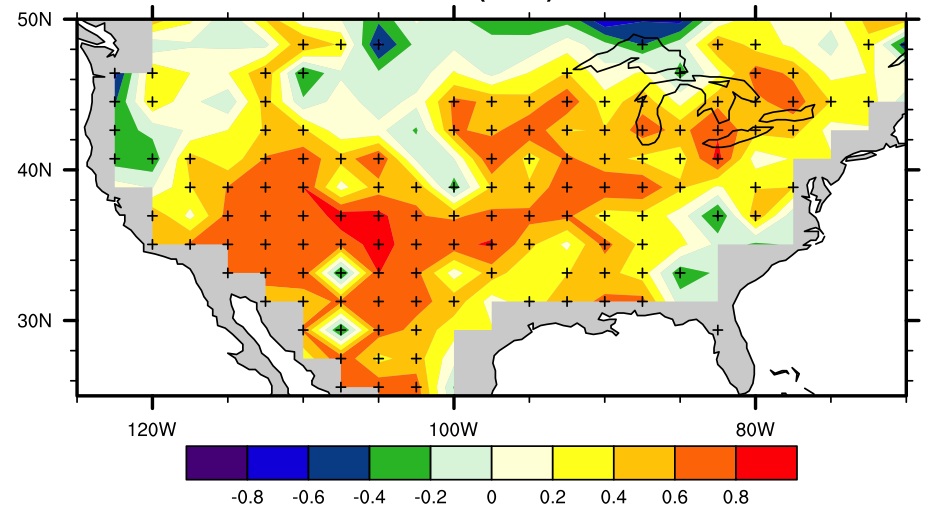
Attached is the map.
Thanks,
Mahesh
---------- Forwarded message ----------
From: Mahesh Varma <mkmvarma@gmail.com>
Date: Thu, Nov 28, 2013 at 7:25 PM
Subject: contour map
To: ncl-talk@ucar.edu
Hi,
I am trying to plot a map (only for CONUS) from a global data set. But, the
map does not fill in at continental boundaries (attached). Is there a way
to fix this? It fills in continental boundaries when I set cnFillMode
="CellFill". I am not sure why it does not fill the continental boundaries
when cnFillMode is set as "AreaFill". Here is the piece of code that I have.
Thanks,
Mahesh
;--------------------------------------
res@mpMinLatF = 25.0;44.25 ; range to zoom in on
res@mpMaxLatF = 50.0;50.
res@mpMinLonF = 235;-130.
res@mpMaxLonF = 290;-60.0
;printMinMax(rel_prcp_per_model_avg,0)
;#########################plotting pdo-cpc correlation regional data
#############################################
;if (PRCP_OBS .EQ. "CPC") then
; res@gsnAddCyclic = False
;end if
;res@cnFillMode = "CellFill"
res@cnMinLevelValF = -0.8 ; set min contour level
res@cnMaxLevelValF = 0.8 ; set max contour level
res@cnLevelSpacingF = 0.2 ; set contour spacing
res@tiMainString = "PDO vs PRCP (OBS):"+byear+"-"+eyear
res@gsnRightString = ""
plot(3) =
gsn_csm_contour_map_ce(wks,reg_coef_cpc_pdo_vs_prcp_1950_2009,res)
_______________________________________________
ncl-talk mailing list
List instructions, subscriber options, unsubscribe:
http://mailman.ucar.edu/mailman/listinfo/ncl-talk