Date: Mon Nov 25 2013 - 11:58:04 MST
Hi all,
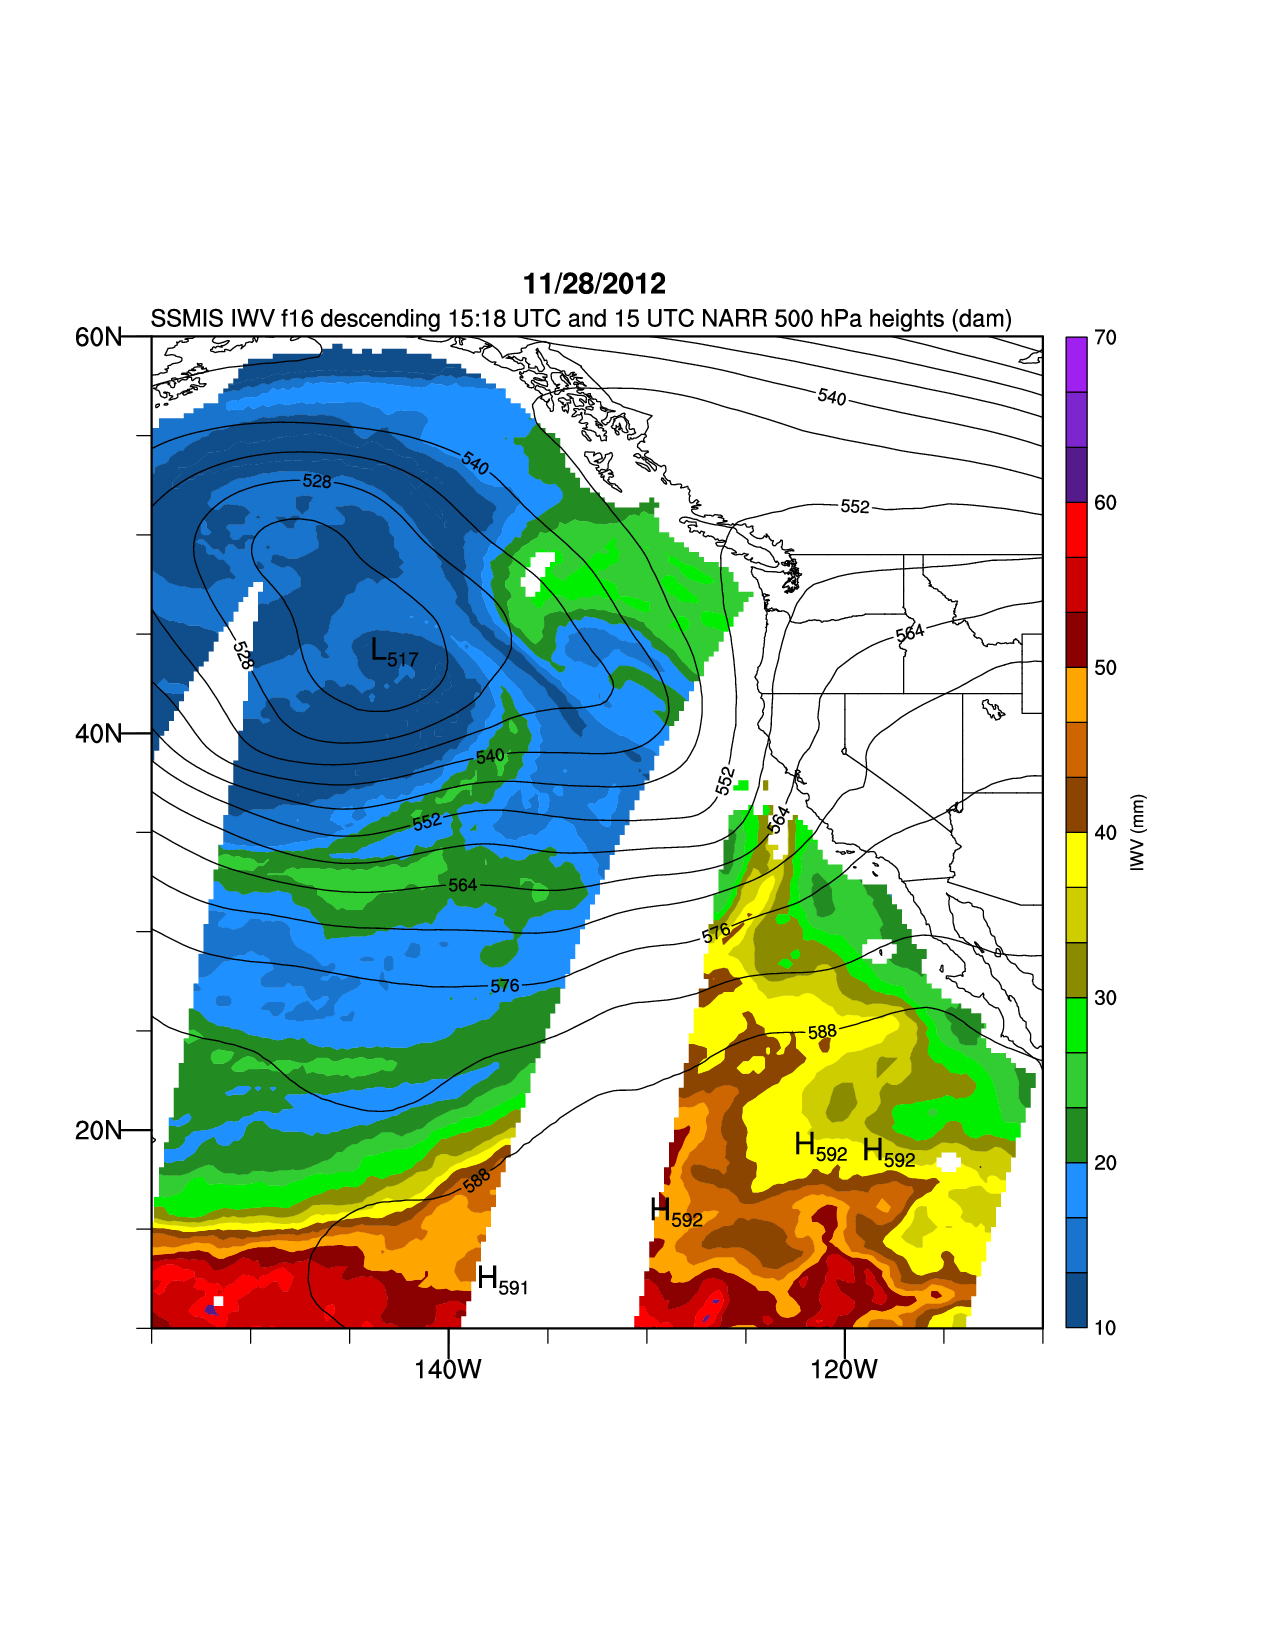
I made a plot of overlaying NARR 500 hPa contours on top of SSMIS
Integrated Water Vapor. That plot looks great, but when I try to make a
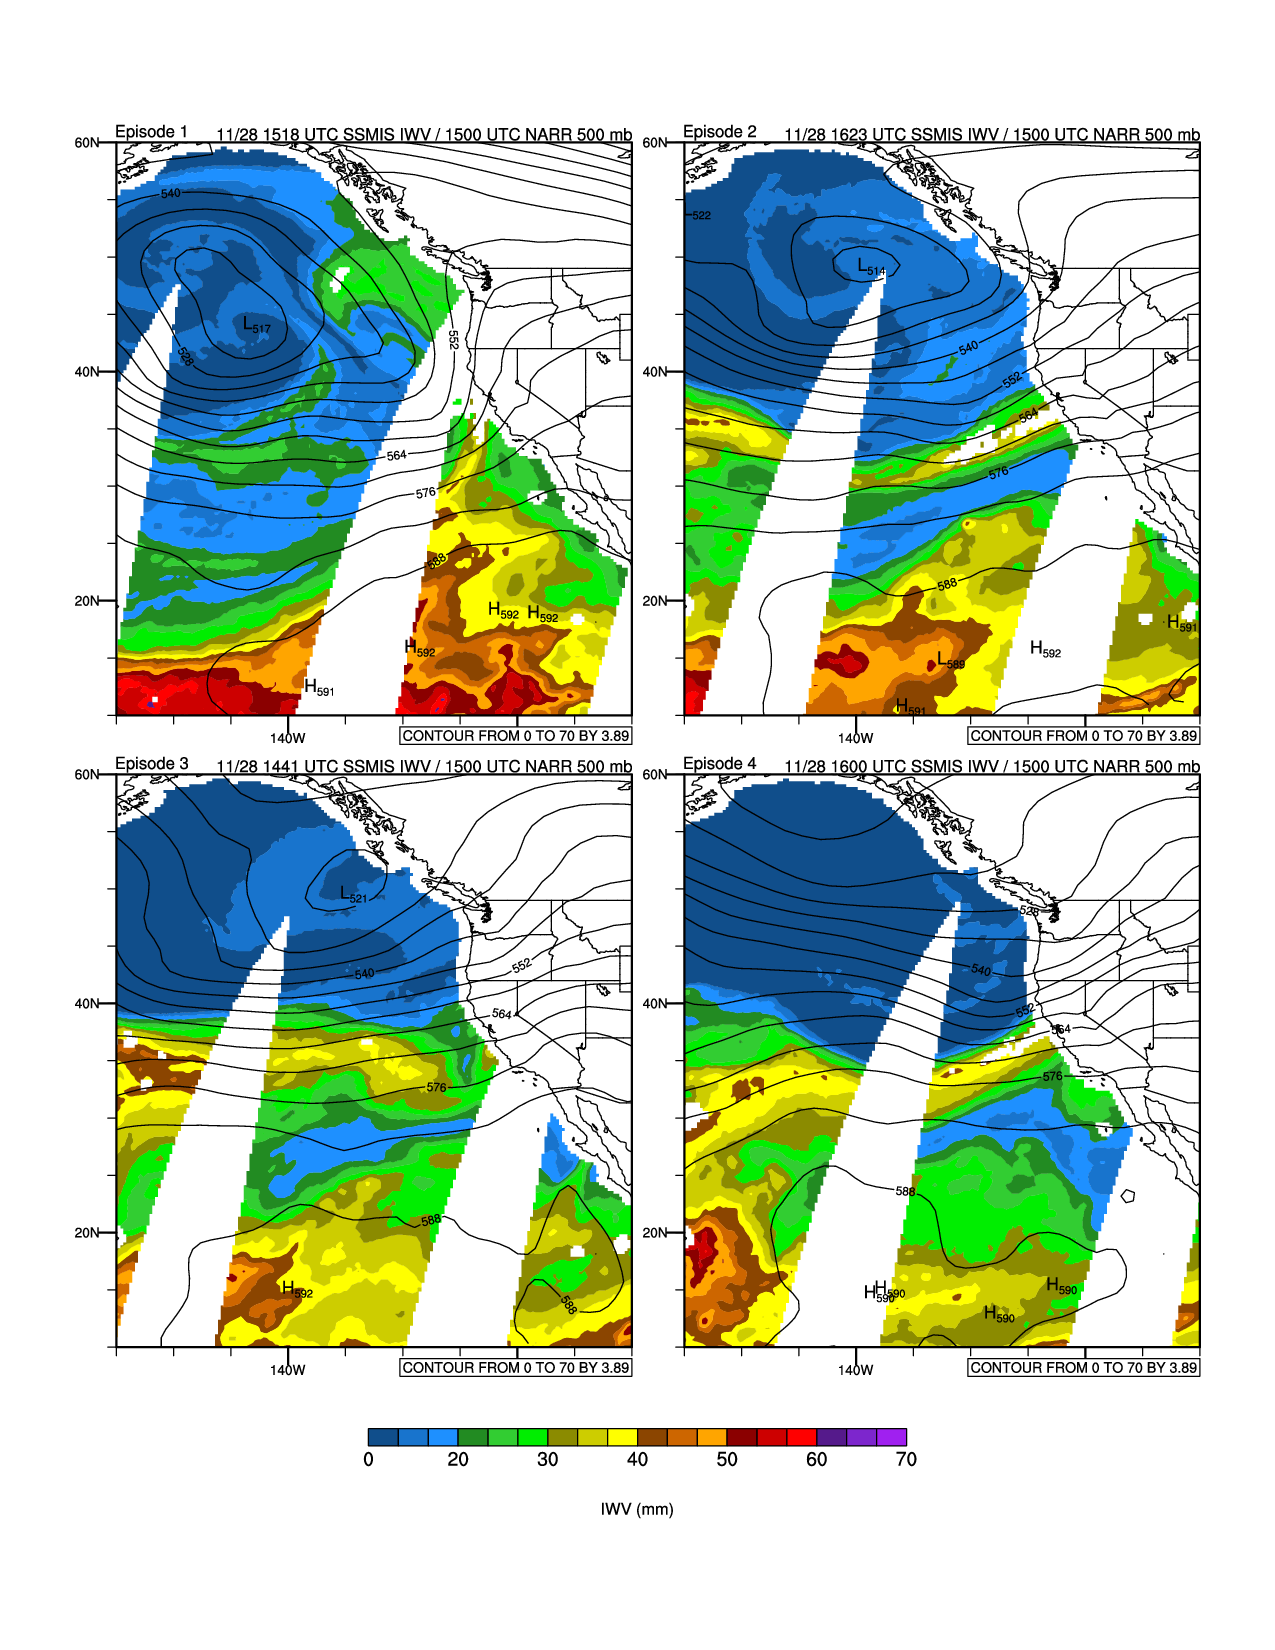
(/2,2/) panel plot for 4 of the same images, ncl seems to ignore some of my
resources. Specifically, I tell it to turn it off the contour Info Label
box by setting that option cnInfoLabelBar = False. Also, I want the
labelbar to span across the entire page (from the beginning of the bottom
left plot to the end of the bottom right). I thought the resources
lbLeftMarginF
=0 and lbRightMarginF = 0 would fix this but it has not. I am not sure why
ncl is ignoring these 2 resources and what I can to to fix these things. I
will attach both images along with my code:
;***************************************************************************
load "$NCARG_ROOT/lib/ncarg/nclscripts/csm/gsn_code.ncl"
load "$NCARG_ROOT/lib/ncarg/nclscripts/csm/gsn_csm.ncl"
load "$NCARG_ROOT/lib/ncarg/nclscripts/csm/contributed.ncl"
begin
;create function to read ssmi file
undef("get_var_ssmi")
function get_var_ssmi(f[1]:file,var[1]:string)
; local utility function for cleaner code
local xs, x, ymdh
begin
xs = f->$var$
xs = where(xs.ge.toshort(251), toshort(255), xs)
xs@_FillValue = toshort(255) ; CF conforming
x = short2flt(xs)
delete(x&time) ; delete type dhort
ymdh = cd_calendar(xs&time, -3) ; yyyymmddhh
x&time = ymdh
return(x)
end
;get info for each episode
; 1 2 3 4
time=(/"1518 UTC","1623 UTC","1441 UTC","1600 UTC"/)
date=(/"20121128","20121130","20121201","20121202"/)
swath="descending"
satnum=(/"f16","f17","f16","f17"/)
fname = "iwv_episodes_panel"
wks = gsn_open_wks ("ps", fname)
;;;;;;;;;;;;;;;;;;;;;;;;;;;;;;;;;;;;;;;;;;;;;;;;;;;;;;;;;;;;;;;;;;;;;;;;;;;;
; MAKE PANEL PLOTS
;;;;;;;;;;;;;;;;;;;;;;;;;;;;;;;;;;;;;;;;;;;;;;;;;;;;;;;;;;;;;;;;;;;;;;;;;;;;
plots = new(4,graphic)
do i=0,3
ssmis_fin="./"+satnum(i)+"/"+satnum(i)+"_ssmis_"+date(i)+"v7.nc"
narr_fin="../NARR/data/narr-a_221_"+date(i)+"_1500_000.grb"
f=addfile(ssmis_fin,"r")
n=addfile(narr_fin,"r")
;============================================================================
;============================================================================
iwv0 = get_var_ssmi(f, "atmosphere_water_vapor_content")
if(swath.eq."descending") then
iwv = iwv0(0,:,:)
else
iwv = iwv0(1,:,:)
end if
;*************create
plots**************************************************************************
;
; colors for iwv plot
colors =
(/"dodgerblue4","dodgerblue4","dodgerblue3","dodgerblue","forestgreen","limegreen","green2","yellow4","yellow3","yell
ow1",\
"darkorange4","darkorange3","orange","red4","red3","red","purple4","purple3","purple"/)
; iwv plot resources
res =True
res@gsnDraw =False
res@gsnFrame =False
res@gsnAddCyclic =False
res@sfXArray =iwv&longitude
res@sfYArray =iwv&latitude
res@cnFillOn = True ; turn on color fill
res@cnLinesOn = False ; Turn off contour lines
res@cnLineLabelsOn = False ; Turn off contour lines
res@cnLevelSelectionMode = "ExplicitLevels"
res@lbLabelBarOn = False
res@lbLabelAutoStride = False
res@cnLabelBarEndStyle = "ExcludeOuterBoxes" ; stop ncl from
adding two extra boxes on label bar
res@cnLevels = (/10, 13.33333,16.66667,20,23.33333,26.66667,30, \
33.33333,36.66667,40,43.33333,46.66667,50, \
53.33333,56.66667,60,63.33333,66.66667,70 /)
res@cnFillColors = colors
; res@cnExplicitLabelBarLabelsOn
res@gsnLeftString = " "
res@gsnRightString = " "
iwv_plot = gsn_csm_contour(wks,iwv,res)
;=============================================================================
;Height
;=============================================================================
hgt = n->HGT_221_ISBL(12,:,:)
hgt = hgt/10.0
lat2d = n->gridlat_221
lon2d = n->gridlon_221
hgt@lat2d = lat2d
hgt@lon2d = lon2d
; height resources
htres = True
htres@gsnDraw = False
htres@gsnFrame = False
htres@gsnAddCyclic = False
htres@gsnLeftString = ""
htres@gsnRightString = ""
clevs = ispan(498,612,6)
htres@cnFillOn=False
htres@cnLinesOn=True
htres@cnLabelMasking = True ; does not draw line
behind label
htres@cnLineLabelBackgroundColor = -1 ; transparent
htres@cnLineLabelFontHeightF = 0.01
htres@cnLevelSelectionMode="ExplicitLevels"
htres@cnLevels = clevs
htres@cnInfoLabelOn = False
htres@cnSmoothingOn = True
;set High/Low Labels
htres@cnInfoLabelOn=False
htres@cnHighLabelsOn = True; label highs
htres@cnHighLabelFormat = ".3f"
htres@cnHighLabelPerimOn = False
htres@cnHighLabelFontHeightF = 0.015; larger H labels
htres@cnHighLabelBackgroundColor = "Transparent"
htres@cnLowLabelsOn = True; label lows
htres@cnLowLabelFormat = ".3f"
htres@cnLowLabelPerimOn = False
htres@cnLowLabelFontHeightF = 0.015; larger L labels
htres@cnLowLabelBackgroundColor = "Transparent"
htres@cnConpackParams = (/ "HLX:2, HLY:2" /)
;make plot
hgt_plot = gsn_csm_contour(wks,hgt,htres)
delete(htres)
;====================================
; Control Map Resources
; Put on Native Lambert Conic Projection and map whole NARR 221 grid
;
mpres=True
mpres@gsnDraw=False
mpres@gsnFrame=False
mpres@mpProjection = "CylindricalEquidistant"
mpres@mpFillOn = False
mpres@mpLimitMode = "LatLon" ; choose range of map
mpres@mpMinLatF = 10.
mpres@mpMinLonF = -155.
mpres@mpMaxLatF = 60.
mpres@mpMaxLonF = -110.
mpres@mpDataBaseVersion = "MediumRes"
mpres@mpOutlineOn = True
; mpres@mpLandFillColor = "gray"
mpres@mpOutlineDrawOrder = "PostDraw"
mpres@mpOutlineBoundarySets = "GeophysicalandUSStates" ; turn on
state boundaries
mpres@tmXTOn = False
mpres@tmYROn = False
mpres@tmXBLabelFontHeightF = 0.009
mpres@tmYLLabelFontHeightF = 0.009 ;tick mark font
mpres@tmXBLabelDeltaF = -0.95 ;space between tickmark label and
actual tick mark
mpres@tmYLLabelDeltaF = -0.95
;titles
mpres@gsnStringFontHeightF = 0.011
mpres@gsnLeftString = "Episode "+tostring(i+1)
mpres@gsnLeftStringOrthogonalPosF = 0.003
mpres@gsnRightString = "11/28 "+time(i)+" SSMIS IWV / 1500 UTC
NARR 500 mb"
mpres@gsnRightStringOrthogonalPosF = 0.003
; mpres@tmXBLabelFontHeightF =0.002
; mpres@tmYLLabelFontHeightF =0.002
;make map
map = gsn_csm_map(wks,mpres)
;overlay maps
overlay(map,iwv_plot)
overlay(map,hgt_plot)
plots(i)=map
end do
pnlres = True
pnlres@gsnMaximize = True
pnlres@gsnPanelLabelBar = True
pnlres@lbLabelAutoStride = False
pnlres@cnLabelBarEndStyle = "ExcludeOuterBoxes" ; stop ncl from
adding two extra boxes on label bar
*pnlres@lbLeftMarginF = 0 *
*pnlres@lbRightMarginF = 0 *
pnlres@lbLabelOffsetF = 0.05 ;determines amount of space between
actual label and labelbar
pnlres@lbLabelStride = 3 ; skip every other label
pnlres@lbTitleString = "IWV (mm)"
pnlres@lbTitleFontHeightF = 0.0085
pnlres@lbTitlePosition = "Bottom"
pnlres@lbBoxMinorExtentF = 0.14 ; perpendicular width of labelbar
pnlres@lbLabelFontHeightF = 0.010
pnlres@pmLabelBarOrthogonalPosF = -0.01
*pnlres@cnInfoLabelOn = False*
gsn_panel(wks,plots,(/2,2/),pnlres)
end
Thanks,
--
Arthur J. Eiserloh, Jr.
San Jose State University
Graduate Student
Dept. of Meteorology and Climate Science
_______________________________________________
ncl-talk mailing list
List instructions, subscriber options, unsubscribe:
http://mailman.ucar.edu/mailman/listinfo/ncl-talk