Date: Sat Dec 14 2013 - 21:22:40 MST
Hello,
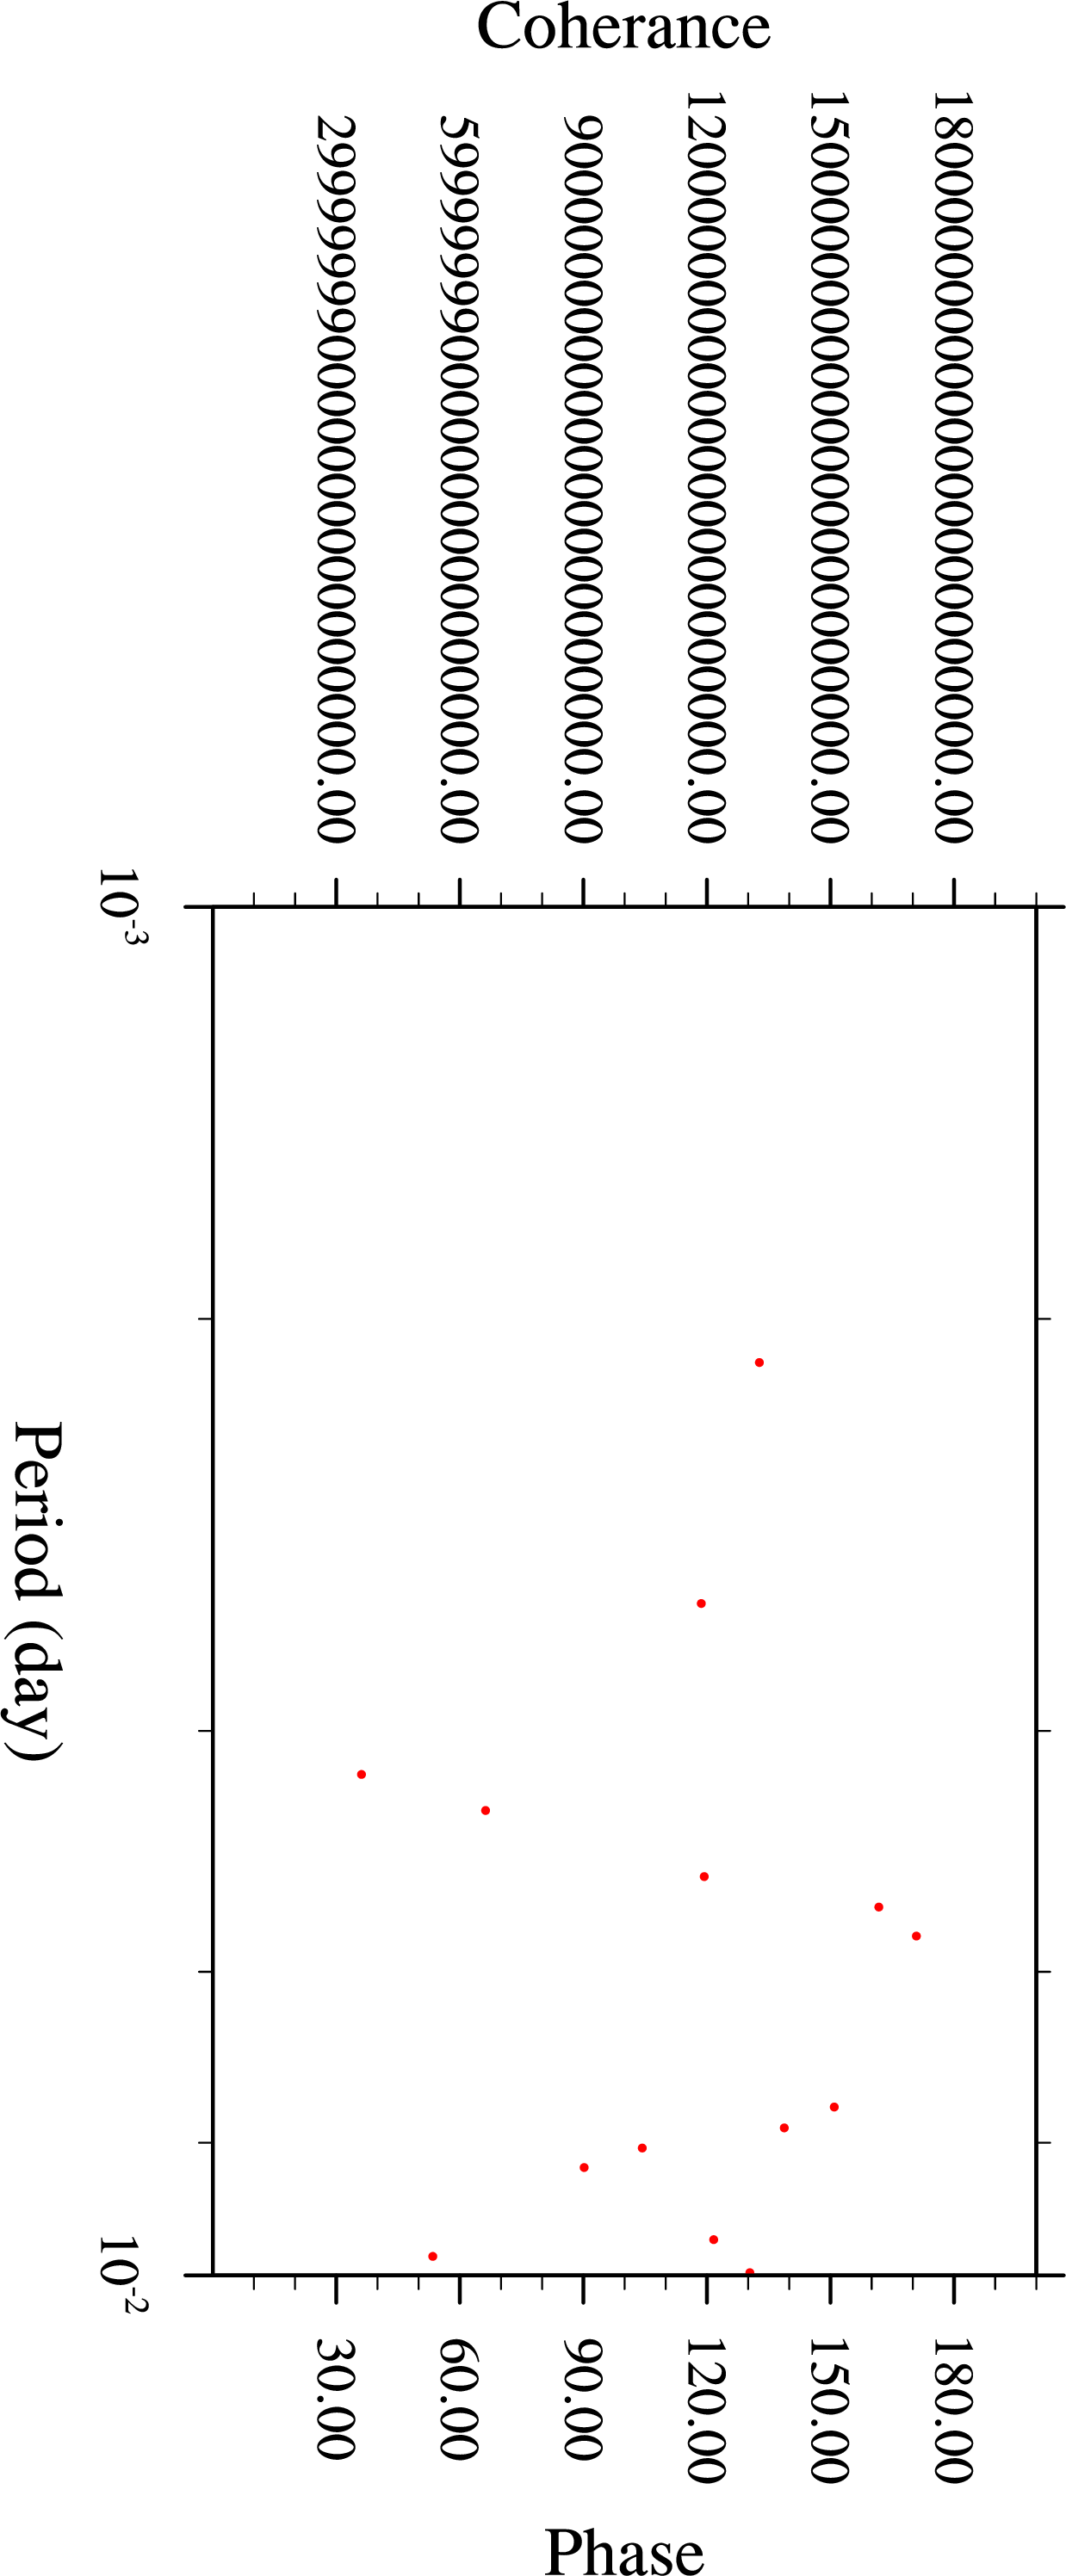
I had got some trouble about the function gsn_csm_xy2. The figure (please see attachment) got from the code as follow looks like wired very much. I do not know the reason for that. It looks like that the resL@trYMinF and resL@trYMaxF do not work, or any other reason?
I had also attached the output files, freq1.dat, freq.dat, coher.dat. The variables's value look like reasonable. But why the figure...? I am confused.
Anyone can help me to take a look at the code? Thank you so much.
;************************************************
; set function arguments
;************************************************
iopt = 0 ; detrending iopt: 0=>remove mean 1=>remove mean and detrend
jave = 5 ; smoothing periodogram: (0 <= sm <= ??.) should be at least 3 and odd
pct = 0.10 ; percent tapered: (0.0 <= pct <= 1.0) 0.10 common.
;************************************************
; calculate spectrum
;************************************************
spec = specxy_anal(xn,yn,iopt,jave,pct)
;; spec@frq=1/spec@frq
;************************************************
; plotting parameters that remain constant
;************************************************
wks = gsn_open_wks("png",picname) ; Opens a ps file
; res = True ; no plot mods desired
; res@gsnFrame = False ; required for panel plots
; res@gsnDraw = False ; required for panel plots
; res@tiXAxisString = "Period (day)" ; xaxis ; Frequency (cycles/day)
; res@trYLog = True
; res@trXLog = True
;***********************************************
; create plot of coherance
;************************************************
dataL=new((/2,dimsizes(spec@coher)/),typeof(spec@coher))
dataL(0,:)=spec@coher
dataL(1,:)=spec@coher_probability(1)
resL = True
resL@gsnMaximize = True
; resL@vpWidthF = 1.0
; resL@trXMinF = 0.001
; resL@trXMaxF = 0.01
; resL@trYMinF = min(dataL(0,:))
; resL@trYMaxF = max(dataL(0,:))
resL@tiYAxisString = "Coherance" ; yaxis
resL@xyLineThicknesses = (/1.0,2.0/)
resL@xyLineColors = (/"black","red"/)
print(min(dataL(0,:)))
print(max(dataL(0,:)))
;***********************************************
; create plot of phase
;************************************************
asciiwrite("probability.dat",spec@coher_probability)
phase=spec@phase
phase@_FillValue= 1e20
phase=where(spec@coher.le.spec@coher_probability(1),phase@_FillValue,phase)
resR = True
; resR@trXMinF = 0.001
; resR@trXMaxF = 0.01
resR@trYMinF = 0. ;
resR@trYMaxF = 60.
resR@tiYAxisString = "Phase" ; yaxis
resR@xyMarkLineModes = "Markers" ; choose which have markers
resR@xyMarkers = 16 ; choose type of marker
resR@xyMarkerColor = "red" ; Marker color
resR@xyMarkerSizeF = 0.005 ; Marker size (default 0.01)
; asciiwrite("coher.dat",dataL(0,:))
; asciiwrite("freq.dat",spec@frq)
plot=gsn_csm_xy2(wks,spec@frq,dataL,phase,resL,resR); create plot
delete(wks)
; resP = True ; panel mods desired
; resP@gsnMaximize = True ; blow up plot
; resP@gsnPanelRowSpec = True ; tell panel whar order to plot
; gsn_panel(wks,plot,(/1,2/),resP) ; create panel plot
; asciiwrite("freq.dat",spec@frq)
system("convert -alpha off -background white -density 300 -trim "+picname+".eps"+" "+picname+wks_type)
2013-12-15
Xueming Zhu 朱学明
Key Laboratory of Research on Marine Hazards Forecasting (LoMF), SOA
National Marine Environmental Forecasting Center (NMEFC)
No.8, Dahuisi Road, Haidian District, Beijing, 100081
People's Republic of China
Tel:+86-10-82481923
_______________________________________________
ncl-talk mailing list
List instructions, subscriber options, unsubscribe:
http://mailman.ucar.edu/mailman/listinfo/ncl-talk
- application/octet-stream attachment: probability.dat
- application/octet-stream attachment: coher.dat
- application/octet-stream attachment: freq.dat