Date: Mon Dec 30 2013 - 16:04:03 MST
Hi All,
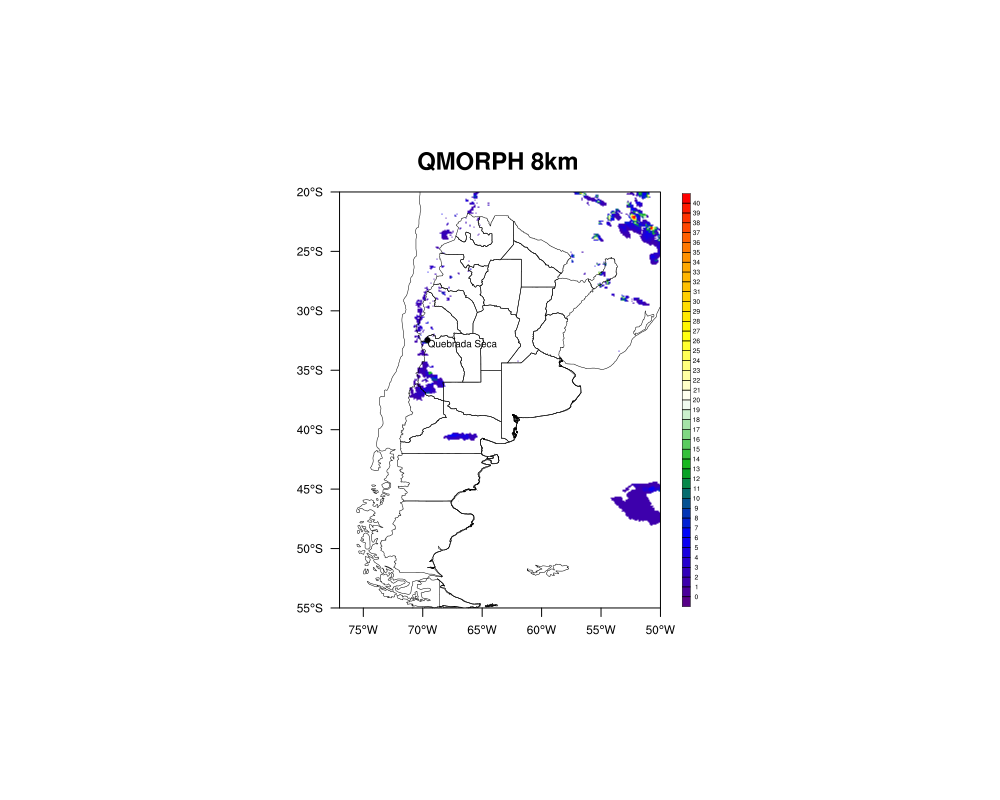
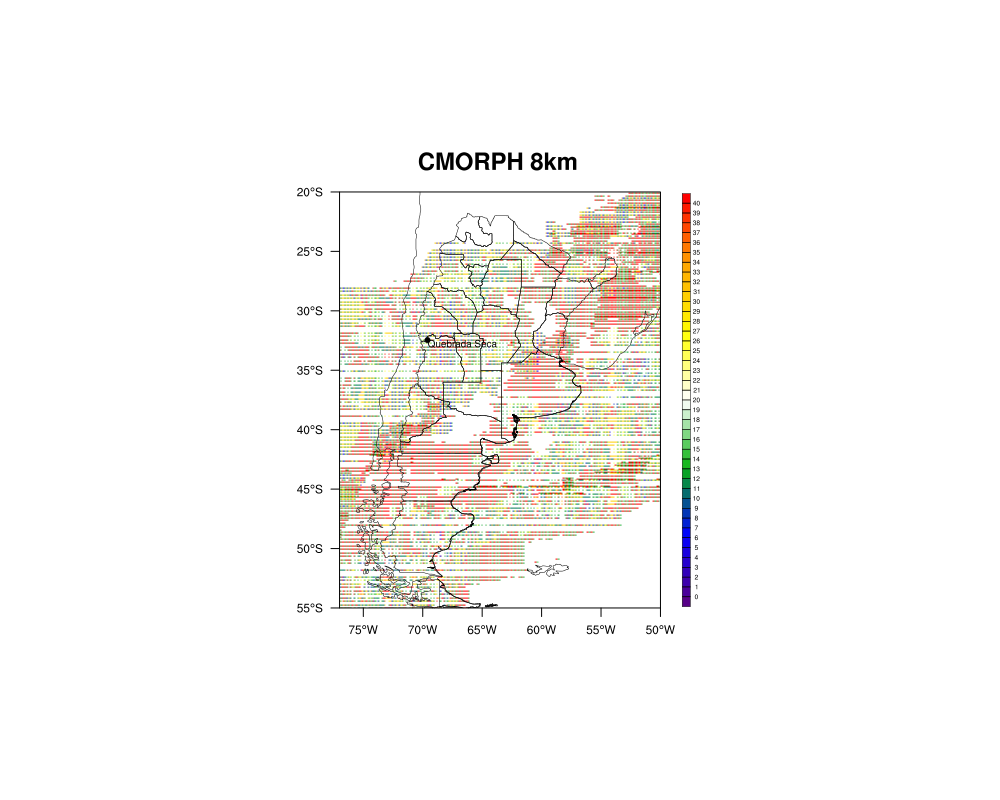
I am plotting for a specific date the precipation estimates by using the
dataset RAW CMORPH that can be found in
ftp://ftp.cpc.ncep.noaa.gov/precip/CMORPH_V1.0/RAW/8km-30min/ and also the
QMORPH found at ftp://ftp.cpc.ncep.noaa.gov/precip/qmorph/30min_8km/. While
for the latter I get reasonable values for the former I get weird values
distribution. Note I am using the same script (see attach script) to
produce the plots (see attached plots). I would really appreciate any hint
on the RAW CMORPH data plotting problem.
Thank you very much in advance,
Ruben
_______________________________________________
ncl-talk mailing list
List instructions, subscriber options, unsubscribe:
http://mailman.ucar.edu/mailman/listinfo/ncl-talk