Date: Tue Feb 18 2014 - 00:44:07 MST
NCL-talk,
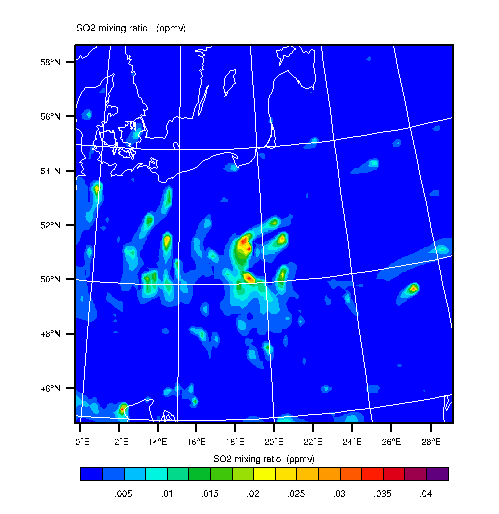
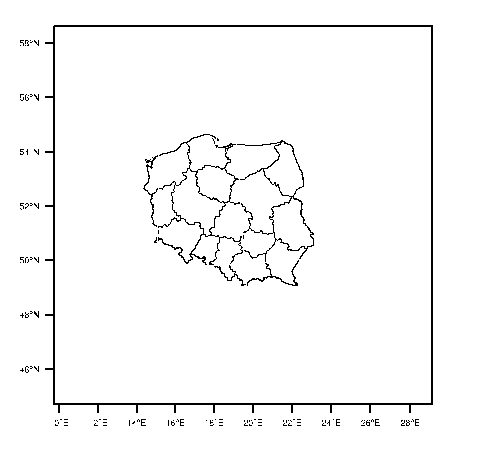
I would like to draw contour map of SO2 concentration (data from .nc file with the use of wrf_contour) with the administrative boundaries of Poland (polylines add from .shp file with the use of gsn_add_polyline)
When I draw it on x11 I receive 2 separate maps (enclosures x11_1 and x11_2), but on .pdf file only first. I suppose that is problem with draw order but I have the same results after "tfPolyDrawOrder" and "cnFillDrawOrder" changing. Could You tell me what's wrong with my script (below)? My ncl version is 6.0.0
Thanks
Hanna
::::::::::::::::::::::::::::::::::::::::::::::::::::::::::::::::::::::::::::::::::::
load "$NCARG_ROOT/lib/ncarg/nclscripts/csm/gsn_code.ncl"
load "$NCARG_ROOT/lib/ncarg/nclscripts/wrf/WRFUserARW.ncl"
load "$NCARG_ROOT/lib/ncarg/nclscripts/csm/gsn_csm.ncl"
begin
a = addfile("/home/data/wrfout_d02_2010-01-02_00:00:00.nc","r")
type="x11"
wks=gsn_open_wks(type,"SO2")
mpres=True
pltres = True
SO2 = wrf_user_getvar(a,"so2",0)
opts = mpres
opts@cnFillOn = True
opts@cnFillDrawOrder="PreDraw"
opts@gsnSpreadColorEnd = -3
contour_SO2 = wrf_contour(a,wks,SO2(0,:,:),opts)
plot = wrf_map_overlays(a,wks,contour_SO2,pltres,mpres)
shape= addfile("/home/hano/Downloads/POL_adm1.shp","r")
segments=shape->segments
geometry=shape->geometry
segsDims=dimsizes(segments)
geomDims=dimsizes(geometry)
geom_segIndex=shape@geom_segIndex
geom_numSegs=shape@geom_numSegs
segs_xyzIndex=shape@segs_xyzIndex
segs_numPnts=shape@segs_numPnts
numFeatures=geomDims(0)
shres = True
shres@gsLineColor="black"
shres@tfPolyDrawOrder="PostDraw"
lines = new(segsDims(0),graphic)
numFeatures = geomDims(0)
lon=shape->x
lat=shape->y
segNum=0
do i=0, numFeatures-1
startSegment=geometry(i, geom_segIndex)
numSegments=geometry(i, geom_numSegs)
do seg=startSegment, startSegment+numSegments-1
startPT = segments(seg, segs_xyzIndex)
endPT = startPT + segments(seg, segs_numPnts) - 1
lines(segNum) = gsn_add_polyline(wks, plot, lon(startPT:endPT), lat(startPT:endPT), shres)
segNum = segNum + 1
end do
end do
draw(plot)
end
_______________________________________________
ncl-talk mailing list
List instructions, subscriber options, unsubscribe:
http://mailman.ucar.edu/mailman/listinfo/ncl-talk