Date: Thu Apr 10 2014 - 10:32:55 MDT
Hi all,
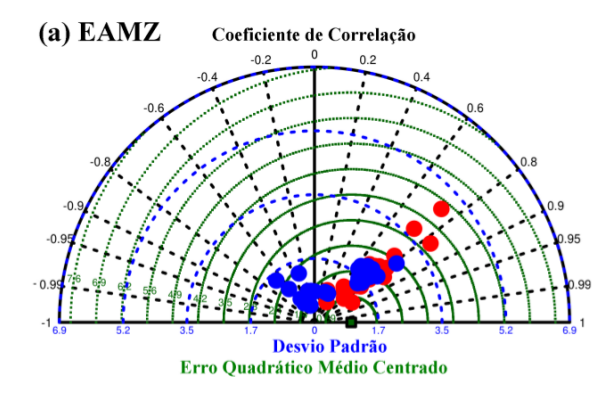
During the creation of Taylor diagram, I saw that some correlations are
negative, and I'd like to plot this values in the taylor diagram. I tryed
modify the "taylor_diagram.ncl", but I'm not capable do this alteration.
I want the same effect of the taylor.png (in attached).
My script (03fig.taylor.ncl) and the picture (.eps) I did are in attached.
Thanks,
Guilherme.
--
https://sites.google.com/site/jgmsantos/
_______________________________________________
ncl-talk mailing list
List instructions, subscriber options, unsubscribe:
http://mailman.ucar.edu/mailman/listinfo/ncl-talk