Date: Thu Apr 03 2014 - 14:18:27 MDT
Hi,
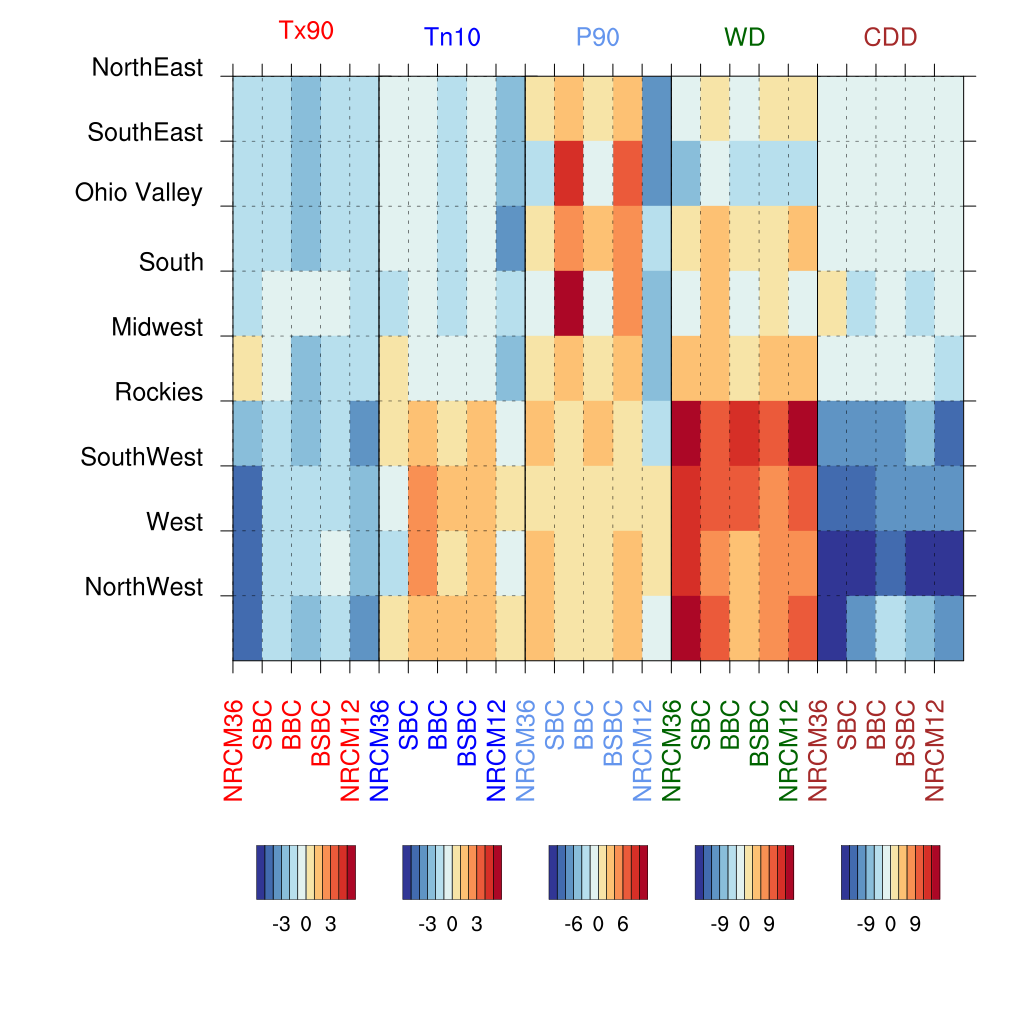
I am having issue with raster plot. I draw five plots using example rater_5.ncl or raster_6.ncl and then marge all five plots using gsn_attach_plots. Now I am trying to turn on X and Y major grid. Surprisingly, its only turns on the major grid for first two plots and last plot, two plots in the middle only have X major grid but no Y major grid .
Please find attached script and plot. Thanks for your help in this regard.
-Debasish
--
Debasish PaiMazumder, PhD
Postgraduate Scientist
Regional Climate Section
NCAR Earth System Laboratory
P.O. Box 3000, Boulder, CO 80307-3000
https://staff.ucar.edu/users/debasish
Tel 303 497 8228
_______________________________________________
ncl-talk mailing list
List instructions, subscriber options, unsubscribe:
http://mailman.ucar.edu/mailman/listinfo/ncl-talk
- text/plain attachment: tree_plot.ncl