Date: Tue Apr 15 2014 - 19:44:34 MDT
Hi,all: I wanna to use wrfout data to draw a cross-section plot with the function "gsn_csm_pres_hgt_vector",which need the data muse be two-dimension. And the leftmost dimension must contain a one-dimensional coordinate array of pressure values, and the values must be in the correct units. the accepted units are "hpa", "hPa", "Pa", "pa", "mb", "millibars", etc.
I checked the dimension names,dimensions and unit of the data involved,
the first dimension name is Vertical and dimensions and sizes: [Vertical | 100] x [Horizontal | 274],I do not know how to handle it,could you gays help me out of this?
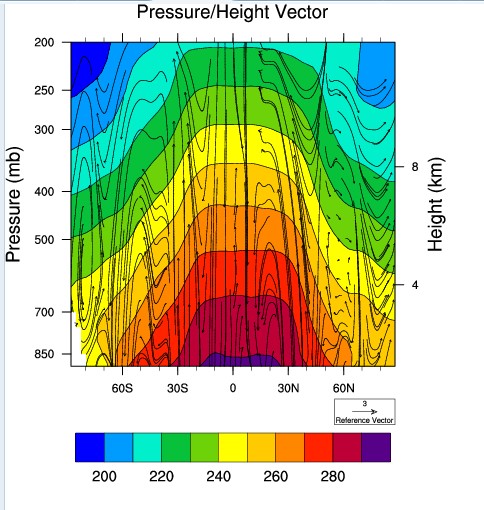
this is my ideal picture:
This is my script:
load "$NCARG_ROOT/lib/ncarg/nclscripts/csm/gsn_code.ncl"
load "$NCARG_ROOT/lib/ncarg/nclscripts/csm/gsn_csm.ncl"
load "$NCARG_ROOT/lib/ncarg/nclscripts/csm/contributed.ncl"
load "$NCARG_ROOT/lib/ncarg/nclscripts/wrf/WRFUserARW.ncl"
begin
; file handling
;************************************************
; define filename
in = addfile("/home/Huanglei/data/d03"+".nc","r") ; open netcdf file
;************************************************
; read needed variables from file
;************************************************
times = wrf_user_getvar(in,"times",-1) ; get times in the file
ntimes = dimsizes(times) ; number of times in the file
FirstTime = True
mdims = getfilevardimsizes(in,"P") ; get some dimension sizes for the file
nd = dimsizes(mdims)
;---------------------------------------------------------------
do it =3,ntimes-1,2 ; TIME LOOP
print("Working on time: " + times(it) )
tc = wrf_user_getvar(in,"tc",it) ; T in C
v = wrf_user_getvar(in,"V",it) ; v wind
w = wrf_user_getvar(in,"W",it) ; w wind
z = wrf_user_getvar(in, "z",it) ; grid point height
wa = wrf_user_unstagger(w, w@stagger)
printVarSummary(w)
printVarSummary(wa)
if ( FirstTime ) then ; get height info for labels
zmin = 0.
zmax = max(z)/1000.
nz = floattoint(zmax/2 + 1)
FirstTime = False
end if
plane = new(4,float)
plane = (/ 2,2, mdims(nd-1)-2, mdims(nd-2)-2 /)
opts = True
t_plane = wrf_user_intrp3d(tc,z,"v",plane,0.,opts)
v_plane = wrf_user_intrp3d(v,z,"v",plane,0.,opts)
w_plane = wrf_user_intrp3d(wa,z,"v",plane,0.,opts)
printVarSummary(w_plane)
printVarSummary(v_plane)
printVarSummary(t_plane)
dim = dimsizes(t_plane) ; Find the data span - for use in labels
zspan = dim(0)
;************************************************
; Omega is significantly smaller than v, so we will
; scale it so that some vertical motion is visible
;************************************************
wAve = avg(w_plane(:,:)) ; used for scaling
vAve = avg(v_plane(:,:))
scale = fabs(vAve/wAve)
wscale = w_plane*scale ; now scale
copy_VarCoords(w_plane, wscale) ; copy coordinate variables
printVarSummary(wscale)
print(t_plane!0)
lev=wscale&Vertical
lev@units=hPa
t_plane!0="lev"
t_plane!1="lon"
v_plane!0="lev"
v_plane!1="lon"
wscale!0="lev"
wscale!1="lon"
printVarSummary(wscale)
print(wscale&lev)
print(t_plane!0)
;***********************************************
; create plot
;***********************************************
wks = gsn_open_wks ("pdf", "vector" ) ; open workstation
gsn_define_colormap(wks,"BlAqGrYeOrRevi200") ; choose color map
res = True ; plot mods desired
res@tiMainString = "Pressure/Height Vector" ; title
res@TimeLabel = times(it) ; Set Valid time to use on plots
res@cnLineLabelsOn = False ; turn off line labels
res@cnFillOn = True ; turn on color fill
res@lbLabelStride = 2 ; every other color
res@gsnSpreadColors = True ; use full range of color map
res@vcRefMagnitudeF = 3.0 ; define vector ref mag
res@vcRefLengthF = 0.045 ; define length of vec ref
res@vcGlyphStyle = "CurlyVector" ; turn on curley vectors
res@vcMinDistanceF = 0.01 ; thin out vectors
res@vcMapDirection = False
;*****************************************************
; draw plot from pole to pole at 170E
;*****************************************************
plot = gsn_csm_pres_hgt_vector(wks,t_plane(:,:),v_plane(:,:),\
wscale(:,:),res )
end do
end
_______________________________________________
ncl-talk mailing list
List instructions, subscriber options, unsubscribe:
http://mailman.ucar.edu/mailman/listinfo/ncl-talk