Date: Mon, 15 Jan 2007 20:30:29 +0200
Hi,
I am plotting a variable using the following comand:
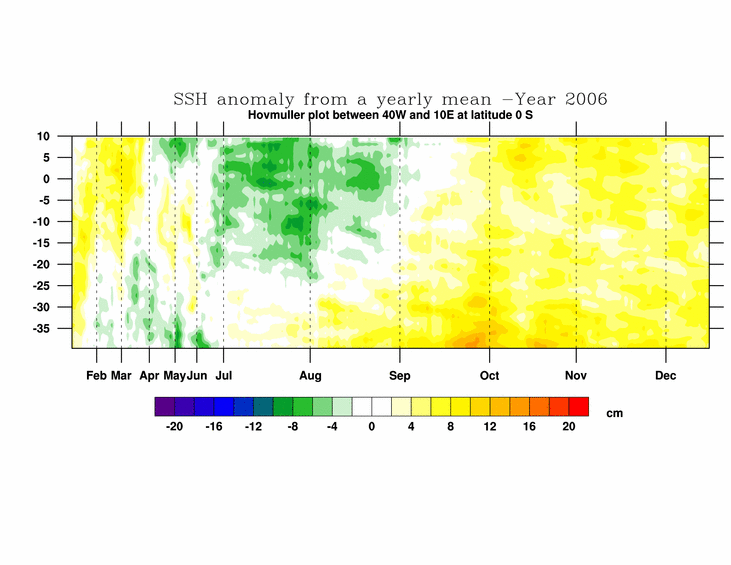
plot = gsn_csm_hov(wks, msla(lon|:,time|yearind), res)
yearind represents the indices of the variable msla falling within a specific year. My problem is that my time axis is not regular. As you will see in the plot, the space between the months changes according to the number of points. I would like the months on my time axis to be regularly spaced even if the number of points within a specific month is not constant.
The output of the program gives the attached plot.
Can anyone help? Thanks in advance.
_______________________________________________
ncl-talk mailing list
ncl-talk_at_ucar.edu
http://mailman.ucar.edu/mailman/listinfo/ncl-talk
