HI, NCL users!
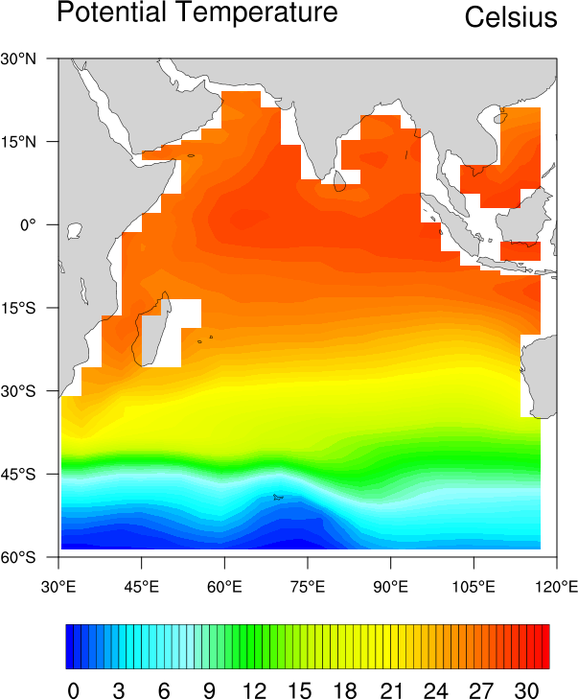
I`m plotting maps like that example (
http://www.ncl.ucar.edu/Applications/Images/ce_3_lg.png), but the South
America is the corresponding plotted area.
I would like that the values of the latitude appeared of 10 in 10 degrees
and not of 15 in 15, as the figure.
OBS.: I'm using "gsn_csm_contour_map" to plot the maps.
Thanks a lot!
--
Luciana Mara Freitas Diniz
_______________________________________________
ncl-talk mailing list
ncl-talk_at_ucar.edu
http://mailman.ucar.edu/mailman/listinfo/ncl-talk
Received on Tue Mar 20 2007 - 12:24:27 MDT
This archive was generated by hypermail 2.2.0 : Thu Mar 22 2007 - 09:26:28 MDT