Date: Thu Mar 04 2010 - 03:29:04 MST
Hi,
I'm working with the EULAG geophysical fluid model and have a script from
a colleague to visualize the output from Direct Access Files.
The original script does contour plots of the output and it works fine. I
once tried a vector-plot within this script and it worked fine too.
Later I decided to make an own script for the vector-plots based on the
contour-plot script, so I removed all contour-parts and rewrote it to plot
velocity vectors over the 2D domain which I'm currently modelling.
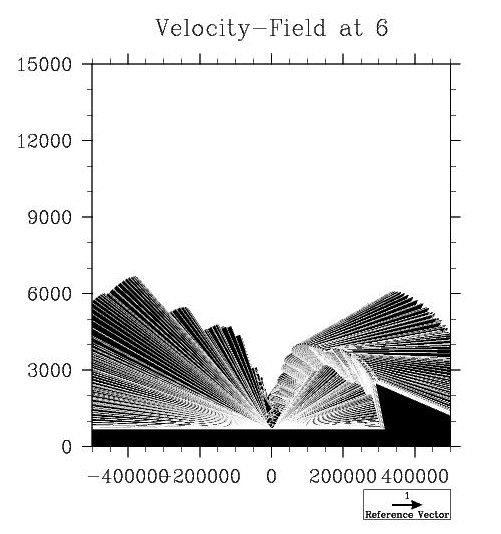
However, the plotting doesn't work as desired, in fact, it plots every
vector at the coordinate (0,0) instead of where they should be. I did a
plot with exaggerated big vectors to illustrate the problem, see the
attached jpg.
I'm using NCL 5.1.0 at the DKRZ Hamburg.
The data is a two-dimensional output in the xz-plane with 301 gridpoints
in z-direction (nz) and 320 in x-cirection (nx), the number of time-steps
nt is
11, ny is obviously 1. The domain-size is 1000km in the horizontal and
15km in the vertical. Scale of u is about 10, scale of w is about 1.
Here's the parts of the code that matter.
I'm pretty new to NCL, so I'm still trying out and playing around with
setting in the res@vc-area. However the problem occurs also when I'm not
using any vc-ressources at all.
load "$NCARG_ROOT/lib/ncarg/nclscripts/csm/gsn_code.ncl"
load "$NCARG_ROOT/lib/ncarg/nclscripts/csm/gsn_csm.ncl"
begin
filepath="./"
nt=fbindirread (filepath+"nt.da",0,1,"integer")
nx=fbindirread (filepath+"nx.da",0,1,"integer")
ny=fbindirread (filepath+"ny.da",0,1,"integer")
nz=fbindirread (filepath+"nz.da",0,1,"integer")
x=fbindirread (filepath+"xxx.da",0,nx,"float")
y=fbindirread (filepath+"yyy.da",0,ny,"float")
z=fbindirread (filepath+"zzz.da",0,nz,"float")
u=fbindirread (filepath+"uuu.da",0,(/nt,nz,ny,nx/),"float")
v=fbindirread (filepath+"vvv.da",0,(/nt,nz,ny,nx/),"float")
w=fbindirread (filepath+"www.da",0,(/nt,nz,ny,nx/),"float")
wks = gsn_open_wks ("pdf","cp002_vec")
res = True ; Plot options desired.
res@gsnFrame = False
res@trXMinF = -500000.
res@trXMaxF = 500000.
res@trYMinF = 0.
res@trYMaxF = 15000.
res@vcGlyphStyle = "FillArrow"
res@vcMinDistanceF = 0.01
res@vcRefLengthF = 0.05
;res@vcMinFracLengthF = 0.33
res@vcRefMagnitudeF = 1.0
;res@vcMonoLineArrowColor = False
res@vcFillArrowsOn = True
;res@vcMonoFillArrowColor = False
;res@vcFillArrowEdgeColor = 1
res@vcFillArrowWidthF = 0.05
do it=0,nt-1
res@tiMainString = "Velocity-Field at "+it
plot = gsn_csm_vector(wks,u(it,:,0,:),w(it,:,0,:),res)
frame(wks)
end do
end
The contour script in which the vector plot looks right uses also these
ressources, however none of them appears in any way important for the
vector-plot to me:
res@cnInfoLabelOn = False
res@cnLevelSelectionMode = "ManualLevels"
res@cnFillOn = True
res@gsnSpreadColors = True
res@cnFillMode = "RasterFill"
res@lbLabelAutoStride = True
res@lbOrientation = "Vertical"
res@cnLineLabelInterval = 100
res@cnLinesOn = False
res@sfXArray = x
res@sfYArray = z
And for every plot individually:
res@tiMainString = "..."
res@cnMinLevelValF = ...
res@cnMaxLevelValF = ...
res@cnLevelSpacingF = ...
Finally, I don't get any error messages, the plot looks just wrong.
What am I doing wrong?
Best wishes
Christian
_______________________________________________
ncl-talk mailing list
List instructions, subscriber options, unsubscribe:
http://mailman.ucar.edu/mailman/listinfo/ncl-talk