That seems to have made the lines go away.
I was looking at the PS file, as I thought the same thing. The screen
shots are from the PS file.
Thanks for your help!
-Josh Thompson
David Brown wrote:
> Hi Josh,
>
> I am guessing this is some sort of artifact of the conversion from PS
> to PNG. Do you see the lines in the PS file? Just as a possible
> workaround you might try setting
> cnFillMode to "RasterFill" along with setting "cnRasterSmoothingOn" to
> True. Let us know what the results of this look like.
> Thanks,
> -dave
>
>
> On Mar 15, 2010, at 12:13 PM, Josh Thompson wrote:
>
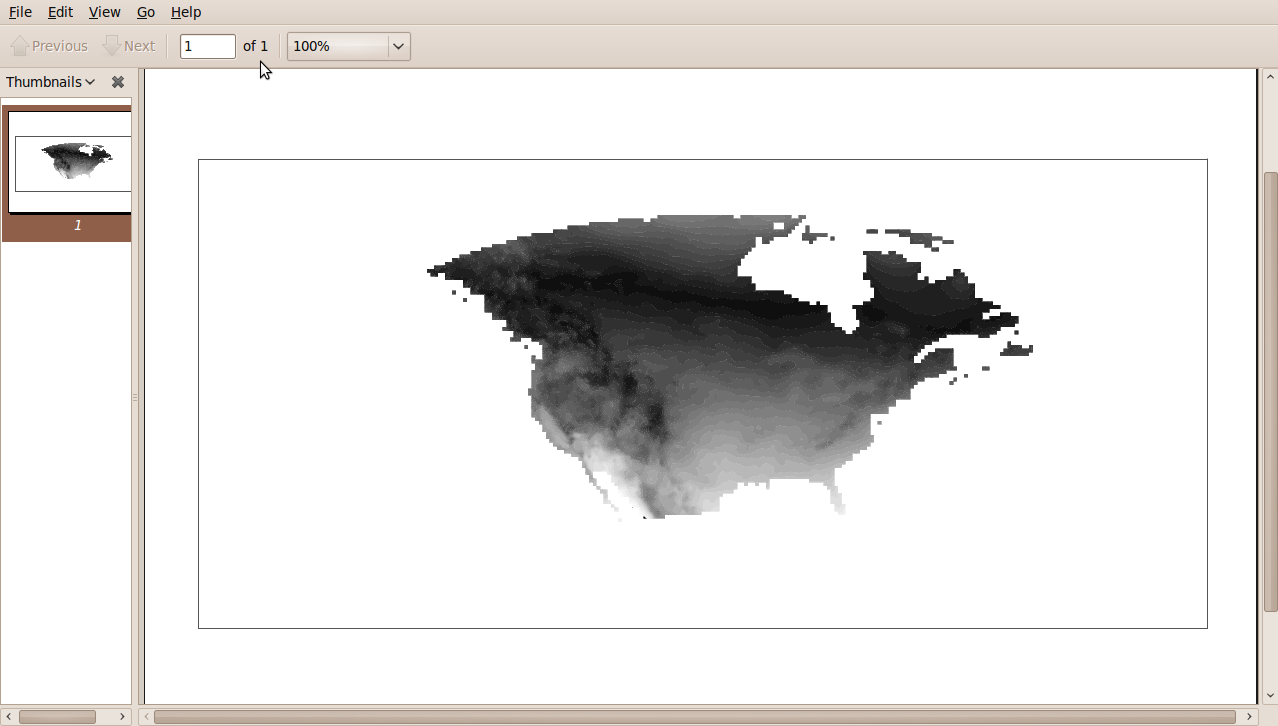
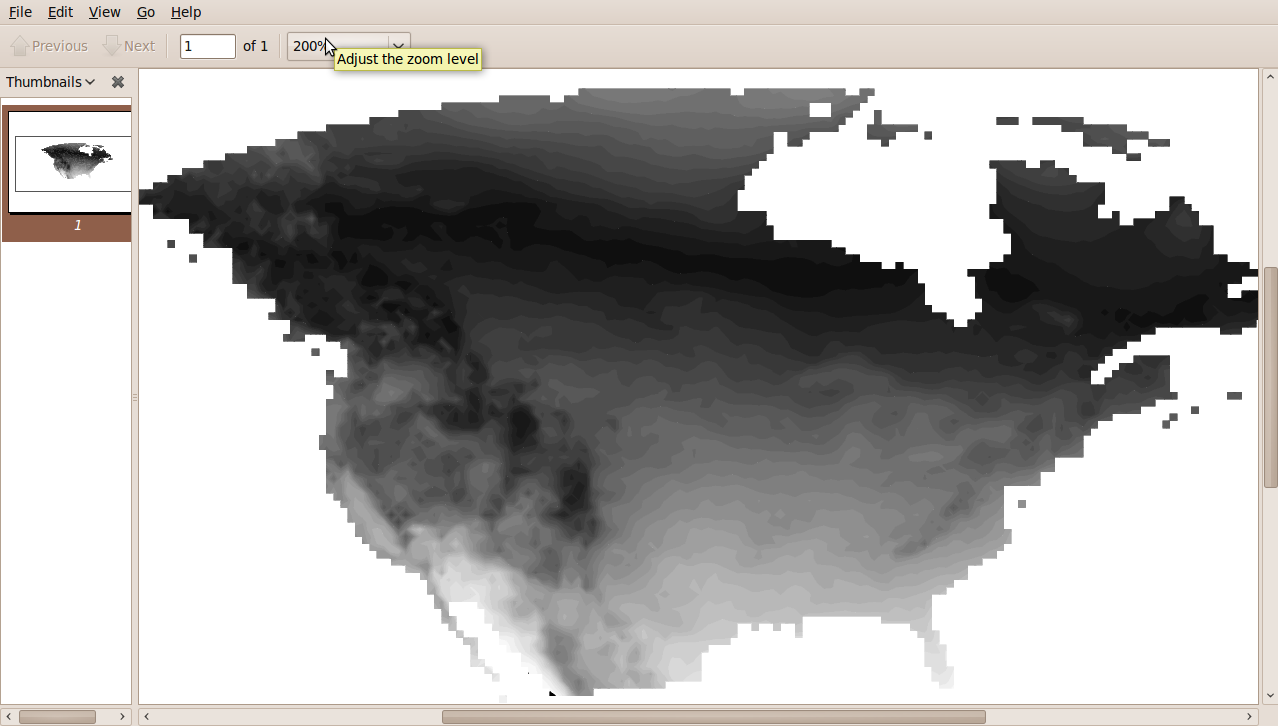
>> I am trying to generate a gray-scale contour plot without contour lines
>> on it. I have set the contour lines resource to "False," but they still
>> show. The odd thing is that they show when "zoomed" to 100%, but not
>> when "zoomed" to ,for example, 200%. This is a problem for me because i
>> need to convert the file to a PNG image. When I do that, the lines show
>> up. Here are a couple screen shots of what I am talking about:
>>
>> http://narccap.ucar.edu/temp/josht/ncl/Screenshot1.png
>> http://narccap.ucar.edu/temp/josht/ncl/Screenshot2.png
>>
>> Here are the resources that I have set in my script:
>>
>> res = True
>>
>> res@gsnMaximize = True
>> res@cnFillOn = True
>> res@mpFillOn = False
>> res@cnLinesOn = False
>> res@gsnSpreadColors = True
>> res@cnFillMode = "AreaFill"
>> res@mpOutlineBoundarySets = "NoBoundaries"
>> res@lbBoxLinesOn = False
>> res@tiMainString = ""
>> res@gsnLeftString = ""
>> res@gsnRightString = ""
>> res@gsnAddCyclic = False
>> res@lbLabelBarOn = False
>> res@lbLabelsOn = False
>> res@lbPerimOn = False
>> res@lbTitleOn = False
>> res@cnLevelFlag = "NoLine"
>> res@cnLineLabelsOn = False
>> res@mpPerimOn = False
>> res@pmTickMarkDisplayMode = "NoCreate"
>> res@tmXBOn = False
>> res@tmXTOn = False
>> res@tmYROn = False
>> res@tmYLOn = False
>> res@tmBorderThicknessF = 0.1
>> res@cnMonoLineThickness = True
>> res@cnLineThicknessF = 0
>>
>> res@mpLimitMode = "LatLon"
>> res@mpMinLatF = 10
>> res@mpMinLonF = -170
>> res@mpMaxLatF = 75
>> res@mpMaxLonF = -30
>>
>> if (varname .eq. "tas" .or. varname .eq. "temp")
>> res@cnLevelSelectionMode = "ManualLevels"
>> res@cnLevelSpacingF = 1.25
>> res@cnMinLevelValF = 0
>> res@cnMaxLevelValF = 37.5
>> end if
>>
>> if (varname .eq. "prtot" .or. varname .eq. "precip")
>> res@cnLevelSelectionMode = "ManualLevels"
>> res@cnLevelSpacingF = 0.6
>> res@cnMinLevelValF = 0
>> res@cnMaxLevelValF = 18
>> end if
>>
>> The full script is at:
>> http://narccap.ucar.edu/temp/josht/ncl/plot_ncep.ncl
>>
>>
>> Thanks for any input!
>>
>> -Josh Thompson
>> _______________________________________________
>> ncl-talk mailing list
>> List instructions, subscriber options, unsubscribe:
>> http://mailman.ucar.edu/mailman/listinfo/ncl-talk
>
_______________________________________________
ncl-talk mailing list
List instructions, subscriber options, unsubscribe:
http://mailman.ucar.edu/mailman/listinfo/ncl-talk
Received on Mon Mar 15 12:47:14 2010
This archive was generated by hypermail 2.1.8 : Wed Mar 17 2010 - 13:00:16 MDT