Date: Wed May 26 2010 - 17:15:43 MDT
Hi Guangshan,
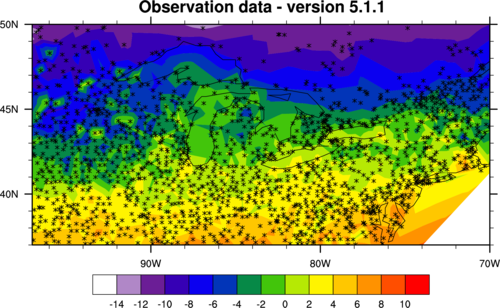
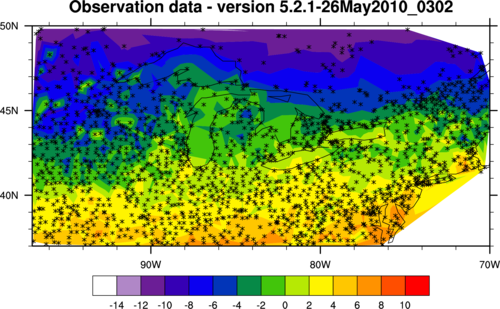
I was able to reproduce the difference you mentioned. However, it seems to me that V5.2.0 is behaving more correctly, as the plot is following the area of the lat/lon locations. I will double-check with Dave Brown on this, but p
lease see the two attached PNG
files (run with V5.1.1 and the latest 5.2.1 internal version). The white space is caused by the fact that there are no lat/lon values outside that area.
--Mary
On May 26, 2010, at 4:12 PM, guangshan chen wrote:
> Hi Youzuo,
>
> The data used and the script used are exactly same. Also the computer is same too. The difference is the version of NCL.
>
> The top figure in each plot is same. It means that "gsn_contour_map_ce" are same to plot two dimension data (lat, lon) in the two version.
>
> The middle and the low figures in each plot are different. It means that "gsn_contour_map_ce" are different to handle one dimension data using "res@sfXArray" and "res@sfYArray".
>
> Guangshan
>
>
> On May 26, 2010, at 4:45 PM, Li, Yongzuo wrote:
>
>> Guangshan,
>>
>> I have looked at your 52 1/2 plots.
>>
>> It seems that something is wrong with data interpolation.
>> The figures at the top for both 5.1 and 5.2 are good.
>>
>> Are you using exactly the same ncl script for 5.1 and 5.2?
>>
>> Yongzuo
>> ________________________________________
>> From: guangshan chen [gchen9@gmail.com]
>> Sent: Wednesday, May 26, 2010 3:29 PM
>> To: Li, Yongzuo
>> Subject: Re: bugs in NCL 5.2.0 for contour map plot (guangshan chen)
>>
>> Yongzuo,
>>
>> Here are them.
>>
>> Guangshan
>>
>>
>> On May 26, 2010, at 2:53 PM, Li, Yongzuo wrote:
>>
>>> Guangshan,
>>>
>>> Put it in png format.
>>>
>>> Yongzuo
>>>
>>> ________________________________________
>>> From: guangshan chen [gchen9@gmail.com]
>>> Sent: Wednesday, May 26, 2010 2:45 PM
>>> To: Li, Yongzuo
>>> Cc: ncl-talk@ucar.edu
>>> Subject: Re: bugs in NCL 5.2.0 for contour map plot (guangshan chen)
>>>
>>> YongZuo,
>>>
>>> I don't have http website to put. Lower left corner is fine. I tried to attached the figures in the last email. But the size is bigger. I will try attached again.
>>>
>>> There are two files:
>>> contour_plot_test_v52data_v51plot.ps ------- plotted by V5.1.1
>>> contour_plot_test_v52data_v52plot.ps -------- plotted by V5.2.0
>>>
>>> You can use my data and script to plot the figures using two versions too.
>>>
>
> _______________________________________________
> ncl-talk mailing list
> List instructions, subscriber options, unsubscribe:
> http://mailman.ucar.edu/mailman/listinfo/ncl-talk
_______________________________________________
ncl-talk mailing list
List instructions, subscriber options, unsubscribe:
http://mailman.ucar.edu/mailman/listinfo/ncl-talk