Date: Mon Jun 07 2010 - 15:58:01 MDT
Hi Adam,
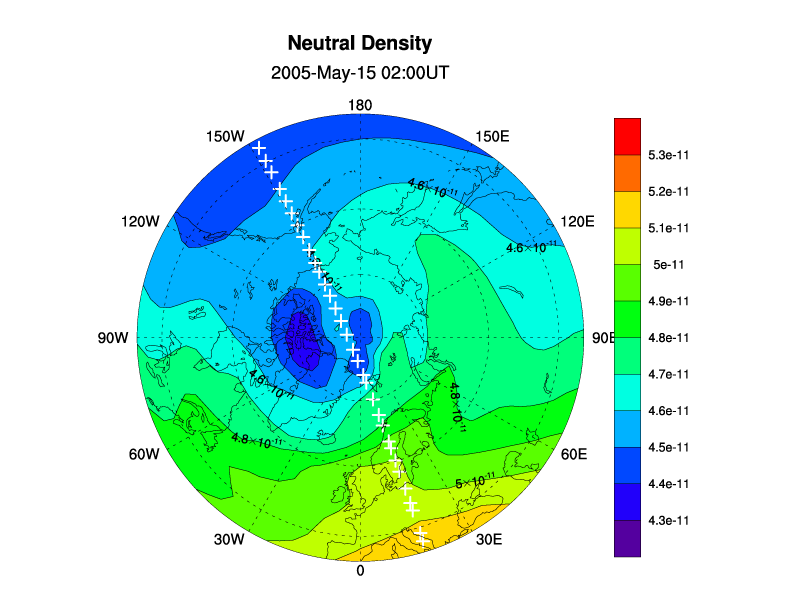
It didn't work.
The version of NCL I'm using is: 5.2.1-28May2010_0735.
So, I'm attaching the script and a png figure showing the resulting plot.
Thanks,
Mariangel.
Adam Phillips wrote:
> Hi Mariangel,
> You should be able to move the label bar to the right by setting
> pmLabelBarOrthogonalPosF = .05
> http://www.ncl.ucar.edu/Document/Graphics/Resources/pm.shtml#pmLabelBarOrthogonalPosF
>
> Without seeing your script, I'm not sure what issues you're having with
> the labelbar resources being ignored.
>
> If the above doesn't help or if you are still having trouble with the
> labelbar, please reply to the group and attach your script.
> Adam
>
> On 06/07/2010 03:15 PM, Mariangel Fedrizzi wrote:
>
>> Dear NCL users,
>>
>> I'm working on a contour plot over a polar stereographic map, and I'm
>> having trouble with the overlapping of the vertical label bar (on the
>> right side) and the polar plot (on the left side). I can't move the
>> label bar to the right or the polar plot to the left. I also can't make
>> changes in label bar. I'm making the plot using "gsn_csm_contour_map_polar".
>>
>> Any help would be very welcome.
>>
>> Thanks,
>> Mariangel.
>>
>> _______________________________________________
>> ncl-talk mailing list
>> List instructions, subscriber options, unsubscribe:
>> http://mailman.ucar.edu/mailman/listinfo/ncl-talk
>>
>
>
;*************************************************
; plot_polar_orbit.ncl
;************************************************
load "$NCARG_ROOT/lib/ncarg/nclscripts/csm/gsn_code.ncl"
load "$NCARG_ROOT/lib/ncarg/nclscripts/csm/gsn_csm.ncl"
load "$NCARG_ROOT/lib/ncarg/nclscripts/csm/contributed.ncl"
;************************************************
begin
;************************************************
; read in netcdf data
;************************************************
dir= "/ncl_work/data/"
plDir = "/ncl_work/plots/" ; output dir for plots
a = addfile(dir+"2005-05-15-plot-density.nc","r")
t = a->time ;(time)
nden = a->density ;(time,plev,lat,lon)
;************************************************
; read in lat lon data from nden .dat files
;************************************************
datafile = "2005-05-15-plot-density_doy135_0743UT_N.dat"
nrow = numAsciiRow(dir+datafile)
ncol = numAsciiCol(dir+datafile)
z1=asciiread(dir+datafile,(/nrow,ncol/),"float")
lat1 = (z1(:,4))
lon1 = (z1(:,5))
;************************************************
; create plot
;************************************************
; see http://www.ncl.ucar.edu/Applications/Scripts/coads_2.ncl for example
;on writing output in another directory.
wks = gsn_open_wks("ps" ,plDir+"polar_orbit"); open a ps file
gsn_define_colormap(wks,"rainbow") ; choose colormap
; Convert to UT time.
ut_date=ut_calendar(t,0)
; Array to hold month abbreviations. Don't store anything in index
; '0' (i.e. let index 1=Jan, 2=Feb, ..., index 12=Dec).
;
month_abbr = (/"","Jan","Feb","Mar","Apr","May","Jun","Jul","Aug","Sep", \
"Oct","Nov","Dec"/)
; Store return information into more meaningful variables.
year = floattointeger(ut_date(:,0)) ; Convert to integer for
month = floattointeger(ut_date(:,1)) ; use sprinti
day = floattointeger(ut_date(:,2))
hour = floattointeger(ut_date(:,3))
minute = floattointeger(ut_date(:,4))
; Write out strings in the format "yyyy-mmm-dd hh:mm UT".
date_str = sprinti("%0.4i", year) + "-" + month_abbr(month) + \
"-" + sprinti("%0.2i ", day) + sprinti("%0.2i", hour) + \
":" + sprinti("%0.2i", minute) + "UT"
tm = 48 ; index 47 eq 12UT??
pl = 12 ; pl 11 eq press level 12??
; plotting all lats lons on a global cylindrical equidistant plot,
; for 12UT and press lev 12.
res = True ; plot mods desired
res@gsnFrame = False ; don't advance yet
res@cnFillOn = True ; color fill
res@cnLinesOn = True ; no contour lines
res@gsnSpreadColors = True ; use full range of color map
res@cnLineLabelBackgroundColor = -1 ;sets the background color used to fill
;the box surrounding each line label
;to transparent
res@cnLineLabelsOn = True
res@lbLabelAutoStride = True ;???
res@mpCenterLonF = 0. ; set center long at 180 deg
res@tmXBMode ="Explicit" ; explicitly set
res@tmXBValues = ispan(0,360,30) ; lon values
res@tmXBLabels = "" + res@tmXBValues ; correspondent lon labels
; the labels around the polar plot are not a tick mark object. They are
; added text. A determination was made as to how far away from the edge
; to place this text. When the ability to blow the text up was added, it
; ran the 0 and 180 text into the line. Therefore the following resource
; was added to move the text out. Note that it moves all the text out, and
; not just the 0 and 180
res@gsnPolarLabelFontHeightF = 0.015 ; blow up font
res@gsnPolar = "NH" ; specify the hemisphere
res@mpMinLatF = 40 ; minimum lat to plot
res@mpFillOn = False
res@lbAutoManage = False
res@lbJustification = "CenterRight"
res@lbOrientation = "Vertical"
res@gsnMaximize = True
res@tiMainString = "Neutral Density"
res@tiMainFontHeightF = 0.02
res@tiMainOffsetYF = -0.001
res@gsnCenterString = date_str(23) ; add titles
res@gsnCenterStringFontHeightF = 0.018
res@gsnCenterStringOrthogonalPosF = 0.07
res@gsnLeftString = ""
res@gsnRightString = ""
mkres = True
mkres@gsMarkerIndex = 2
mkres@gsMarkerColor = "White"
mkres@gsMarkerSizeF = 20. ; Increase marker sizes.
mkres@gsMarkerThicknessF = 4 ; specifies the thickness of the marker
plid = gsn_csm_contour_map_polar(wks,nden(23,11,:,:),res)
; Now attach the markers to the plot and notice that you don't
; see them until you draw the plot.
;
; If you resize the plot, the markers will be resized accordingly.
obid = gsn_add_polymarker(wks,plid,lon1,lat1,mkres)
draw(plid)
frame(wks)
end
_______________________________________________
ncl-talk mailing list
List instructions, subscriber options, unsubscribe:
http://mailman.ucar.edu/mailman/listinfo/ncl-talk