Date: Mon Jun 07 2010 - 09:03:06 MDT
Hello everyone,
I am facing some trouble to plot contour of 2m-temperature from GFS data
downloaded from NCEP FTP site (for example, gfs.t18z.pgrb2f06)
NCL crashes when I run my script with default contour fill mode (area
fill mode) but is ok with RasterFill mode.
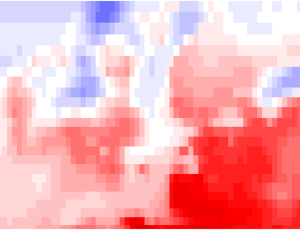
But with a 0,5° resolution I would really appreciate area mode because
raster mode is not that pretty (see example attached)
Did someone already experience plotting filled contour for
2m-temperature from GFS?
Caroline
--
Caroline Serraud - Ingénieur Etudes & Développements
------------------------------------------------------
METEO CONSULT / La Chaine Météo - Groupe Figaro
Département Informatique
Domaine de Marsinval F-78540 Vernouillet, FRANCE
Tél : 01 39 28 1990 - Fax : 01 39 71 85 31
e-mail : cs@meteoconsult.fr
------------------------------------------------------
Toute la météo sur le Web : http://www.meteoconsult.fr
Toute la météo par téléphone : 3201
;*************************************************
; tempe_gfs.ncl
;************************************************
load "$NCARG_ROOT/lib/ncarg/nclscripts/csm/gsn_code.ncl"
load "$NCARG_ROOT/lib/ncarg/nclscripts/csm/gsn_csm.ncl"
load "$NCARG_ROOT/lib/ncarg/nclscripts/csm/contributed.ncl"
load "$NCARG_ROOT/lib/ncarg/nclscripts/csm/shea_util.ncl"
;************************************************
begin
if (.not.isvar("v_file")) then
print("Le nom du fichier source n'est pas defini")
exit()
end if
;************************************************
; read in netCDF file
;************************************************
a = addfile(v_file,"r")
;************************************************
; read in zonal [u] and meridional [v] winds
;************************************************
t = a->TMP_P0_L103_GLL0(:,:)
t = t - 273.15
delete(t@units)
delete(t@long_name)
i_lat_min = v_lat_min + 0
i_lat_max = v_lat_max + 0
i_lon_min = v_lon_min + 0
i_lon_max = v_lon_max + 0
;************************************************
; create plot
;************************************************
wks_type = "ps"
wks =gsn_open_wks(wks_type,"tempe")
gsn_define_colormap(wks,"BlWhRe") ; choose color map
res = True ; plot mods desired
res@gsnMaximize = True
res@gsnPaperOrientation = "landscape"
res@gsnBoxMargin = 0.0
res@gsnAddCyclic = False ; regional data
res@lbLabelBarOn = False
res@tmXBOn = False ; don't draw axis nor axis labels
res@tmXTOn = False
res@tmYLOn = False
res@tmYROn = False
res@cnLevelSelectionMode = "ManualLevels"
res@cnMinLevelValF = -15.
res@cnMaxLevelValF = 35.
res@cnLevelSpacingF = 1.
res@cnFillOn = True ; turn on color for contours
res@cnLinesOn = False ; turn off contour lines
res@cnLineLabelsOn = False ; turn off contour line labels
res@cnFillColors = ispan(2,102,2)
res@cnInfoLabelOn = False
; res@cnFillMode = "RasterFill"
; zoom in on map
res@mpDataBaseVersion = "RANGS_GSHHS" ; high resolution coastline
res@mpDataResolution = "FinestResolution"
res@mpFillOn = False
res@mpOutlineOn = False
res@mpPerimOn = False
res@mpProjection = "mercator"
res@mpLimitMode = "Corners"
res@mpLeftCornerLatF = i_lat_min
res@mpLeftCornerLonF = i_lon_min
res@mpRightCornerLatF = i_lat_max
res@mpRightCornerLonF = i_lon_max
plot=gsn_csm_contour_map(wks,t,res)
end
_______________________________________________
ncl-talk mailing list
List instructions, subscriber options, unsubscribe:
http://mailman.ucar.edu/mailman/listinfo/ncl-talk