Date: Fri Sep 24 2010 - 02:11:10 MDT
Dear Louis,
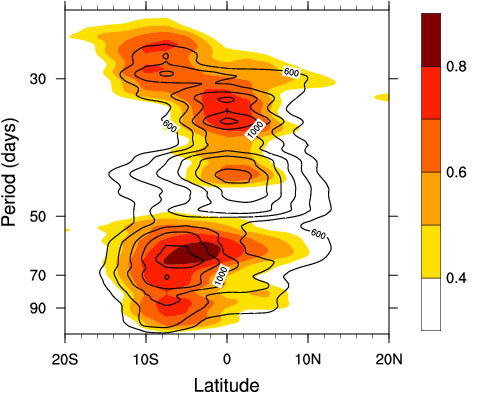
I guess what you are trying to do is similar to the attached figure (Saji et
al 2006, GRL). As I mentioned earlier, it is straighforward to do in NCL.
The easiest is to use 'specx_anal'. However, since you would have to repeat
the analysis for multiple grid points, it is not an efficient approach. In
my case, I used ezfftf and wrote some functions to calculate the
significance etc. ezfftf is documented here:
http://ncl.ucar.edu/Document/Functions/Built-in/ezfftf.shtml
If you use ezfftf approach, you should take care to do appropriate
pre-processing and post-processing
Pre-processing includes detrending and tapering the data. Also if you want
to calculate the spectrum for only a particular season (say DJF), you
should mask the data, so that values during other seasons are reduced in
amplitude
Post-processing involves smoothing the raw spectrum for robust estimation.
In the following code, a Daniell window is used (see
http://www.ltrr.arizona.edu/~dmeko/notes_6.pdf)
Following is some example code. Let me know if you have any questions..
saji
--
Say, you have a variable called "var"
Pre-processing
---
ntaper=10
var=dtrend(var,False)   ; in my case I rewrote the var to be 2D (dim0 =
points in grid space, dim1 = time);
var=taper(var,ntaper,0)
ntim = dimsizes(var&time)
nsmooth=9 ; width of Daniell window
ibase2 = floattointeger(log(ntim)/log(2.0)) + 1
npad = floattointeger(2.0^ibase2) - ntim   ; padding primarily to increase
frequency resolution
                                                            ; any way I
forgot to pad the data in the following -- take care of that by yourselves
dan_win= Daniell_Window(nsmooth)
sclfactor = 2.0/sum(dan_win^2)
df = Calculate_Dof(dan_win,ntim,npad,ntaper) ; calculate Degrees of freedom,
after accounting for effects of
                                                                   ;
spectral smoothing, padding and tapering (see the notes from 'dmeko' above)
cf = ezfftf(var)*dble2flt(sclfactor)
psd = cf(0,:,:)^2 + cf(1,:,:)^2   - sum of power of real and imaginary parts
nfrq = dimsizes(psd(0,:))
psd(:,nfrq-1) = psd(:,nfrq-1)/2.0   ; why? i forgot why ;()
frq=ispan(0,nfrq,1)/int2flt(ntim)
freq=frq(1:)
;---calculate red spectra
rspc=rspec(var,freq)
add_dimensions(rspc, (/"latlon", "frq"/))
add_dimensions(psd,(/"latlon","frq"/))
psd&frq=freq
rscale = dim_sum(psd)
rspc=rspc*conform(rspc,rscale,0)
xHigh = chiinv(0.95, df)/df  ; estimating 95% siglev
rspc=rspc*xHigh  ; peaks higher than this are significant at 95% sig lev
; -- smooth spectra with dan_win
psd = wgt_runave(psd,dan_win,0)
;---- write out psd and rspc and do the plotting in a separate script.
function Daniell_Window(nsmooth)
begin
       dan_win=new(nsmooth,"double")
        dan_win(1:nsmooth-2)=1/int2flt(nsmooth-1)
        dan_win(0)=1/(2*int2flt(nsmooth-1))
        dan_win(nsmooth-1)=dan_win(0)
        return (dan_win)
end
function Calculate_Dof(dan_win,ntim,npad,ntaper)
begin
        cp=int2flt(ntim+npad)/int2flt(ntim)
        ct=128*1.d0-(93*1.d0*ntaper)
        ct=ct/(2.d0*(8-5*ntaper)^2)
        gu2=sum(dan_win^2)
        gw2=ct*cp*gu2
        df=doubletoint(2.d0/gw2)
        print("Degrees of Freedom ::: "+df)
return(df)
end
function rspec(var,freq)
begin
        ndims=dimsizes(dimsizes(var))
        if (ndims.gt.4) then
        print("This function does not currently handle variables with
dimensions greater than 4")
        exit
        end if
        acr = esacr(var,1)
        if (ndims.eq.1) then
        lag1=acr(1)
        rho=new( (/1,1/),typeof(lag1))
        end if
        ;
        if (ndims.eq.2) then
        lag1=acr(:,1)
        n1=dimsizes(lag1)
        rho=new( (/n1,1/),typeof(lag1))
        end if
        ;
        if (ndims.eq.3) then
        lag1=acr(:,:,1)
        n1=dimsizes(lag1(:,0))
        n2=dimsizes(lag1(0,:))
        rho=new( (/n1,n2,1/),typeof(lag1))
        end if
        ;
        if (ndims.eq.4) then
        lag1=acr(:,:,:,1)
        n1=dimsizes(lag1(:,0,0,0))
        n2=dimsizes(lag1(0,:,0,0))
        n3=dimsizes(lag1(0,0,:,0))
        rho=new( (/n1,n2,n3,1/),typeof(lag1))
        end if
        ;.................................
        rho = lag1
        pi=4.d0*atan(1.d0)
        omega=new((/1,dimsizes(freq)/),typeof(freq))
        omega=freq*2.0*dble2flt(pi)
        rhosqr=rho*rho
        tworho=2*rho
        rank=dimsizes(dimsizes(rho))
        if (rank.eq.3) then
        rspc=new( (/n1,n2,dimsizes(freq)/), typeof(freq))
        do i = 0,n1-1
        rspc(i,:,:)=tworho(i,:,:)#cos(omega)
        end do
        end if
       if (rank.eq.4) then
        rspc=new( (/n1,n2,n3,dimsizes(freq)/), typeof(freq))
        do i = 0,n1-1
          do j = 0,n2-1
          rspc(i,j,:,:)=tworho(i,j,:,:)#cos(omega)
          end do
        end do
        end if
        if (rank.lt.3) then
        rspc=tworho#cos(omega)
        end if
        if (rank.eq.4) then
        rspc=(1-conform(rspc,rhosqr(:,:,:,0),(/0,1,2/)) ) /  \
                (1-rspc+conform(rspc,rhosqr(:,:,:,0),(/0,1,2/)) )
        end if        if (rank.eq.3) then
        rspc=(1-conform(rspc,rhosqr(:,:,0),(/0,1/)) ) /  \
                (1-rspc+conform(rspc,rhosqr(:,:,0),(/0,1/)) )
        end if
        if (rank.lt.3) then
        rspc=(1-conform(rspc,rhosqr(:,0),0) ) /  \
                (1-rspc+conform(rspc,rhosqr(:,0),0) )
        end if
        return rspc
end
procedure add_dimensions(var,att_array)
begin
 ndims=dimsizes(att_array)
  do i = 0,ndims-1
   var!i=  att_array(i)
  end do
end
On Mon, Sep 20, 2010 at 5:00 PM, louis Vonder <appopson@yahoo.fr> wrote:
> Dear all,
> I facing the following problem:
> I want to draw the power spectrum of the mean daily cycle of the zonal wind
> (from NCEP/NCAR reanalysis) greater than a given threshold in the Hovmöller
> space.
>
> I want to represent the power spectrum such that latitude in x-axis and
> period in y-axis.
>
> An example of what I am trying to do is available in Figure 14a of
> R. E. CARBONE, J. D. TUTTLE, D. A. AHIJEVYCH, AND S. B. TRIER
> Inferences of Predictability Associated with Warm Season Precipitation
> Episodes, 2002, JOURNAL OF THE ATMOSPHERIC SCIENCES, 59, 2033-2056.
>
>
> There is any way to do it with NCL?
>
> Best regards
>
>
>
>
>
>
>
>
>
>
>
>
>
>
>
>
>
>
> _______________________________________________
> ncl-talk mailing list
> List instructions, subscriber options, unsubscribe:
> http://mailman.ucar.edu/mailman/listinfo/ncl-talk
>
>
_______________________________________________
ncl-talk mailing list
List instructions, subscriber options, unsubscribe:
http://mailman.ucar.edu/mailman/listinfo/ncl-talk