Does anyone know why the NCL statements that should create
superscripts are not working in my script ?. I have used these
statements before on my local computer where they seemed to work
fine. However, I am running on another computer (a large multi-user
machine), and they no longer seem to produce superscripts, but just
print the codes exactly the way I typed them in (this machine is
using NCL version 5.2.1).
I had to replace "gsn_csm.ncl" with my own version, since I use a non-
standard set of pressure levels. However, I suspect that this is not
where the codes for doing superscripts are set. I think they may be
set within "gsn_code.ncl", for which I use the standard version.
Does anyone know what I need to do to get superscripts to print
properly ?.
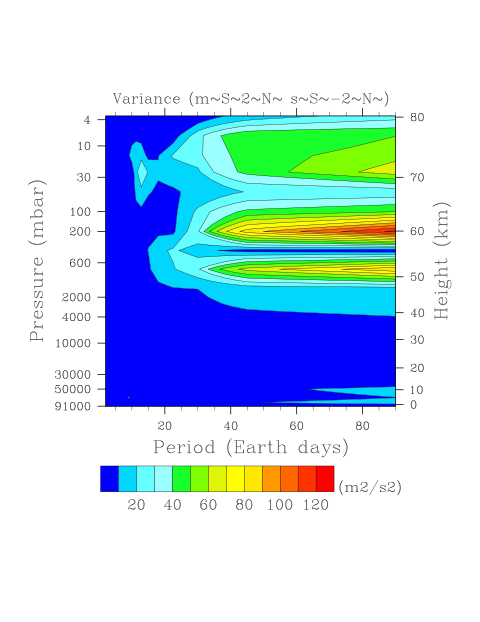
I enclose the script I used and the plot which it produced.
Thanks,
Helen.
1) The plot
2) The script I used :
;***********************
; fourtest.ncl
;***********************
load "$NCARG_ROOT/lib/ncarg/nclscripts/csm/gsn_code.ncl"
;load "$NCARG_ROOT/lib/ncarg/nclscripts/csm/gsn_csm.ncl"
load "/p/lscratchd/parish3/gsn_csm.ncl"
load "$NCARG_ROOT/lib/ncarg/nclscripts/csm/contributed.ncl"
;***********************
begin
diri = "./"
fili = systemfunc("cd "+diri+" ; ls hera*.cam2.h0*nc")
print(fili)
nfili = dimsizes(fili)
lev_p = (/ 91500., 90000., 87500., 80000., 67500., 50000., 30000.,
20000., 10000., 5000., 3000., 1500., 750., 390., 200., 100., 50.,25.,
14., 7., 3.5, 1.9, 0.95, 0.4, 0.1, 0.03 /)
do nf = 0, nfili-1
fi = addfile (diri+fili(nf), "r")
nfa = 100.0
nfb = nfa+nf
diro = "./"
filo = "uhelen"+nfb+".nc"
print(filo)
system ("/bin/rm -f "+diro+filo) ; remove any pre-exist file
fo = addfile (diro+filo, "c")
hyam = fi->hyam ; read hybrid info
hybm = fi->hybm
hyai = fi->hyai ; read hybrid info
hybi = fi->hybi
PS = fi->PS
P0mb = 0.01*fi->P0
U = fi->U
time = fi->time
lat = fi->lat
lon = fi->lon
lev_p!0 = "lev_p" ; variable and dimension name
the same
lev_p&lev_p = lev_p ; create coordinate variable
lev_p@long_name = "pressure" ; attach some attributes
lev_p@units = "hPa"
lev_p@positive = "down"
Up = vinth2p (U, hyam, hybm, lev_p ,PS, 1, P0mb, 2, False)
copy_VarAtts(U, Up)
fo->U = Up ; write to netCDF file
fo->time = time ; write to netCDF file
fo->lat = lat ; write to netCDF file
fo->lon = lon ; write to netCDF file
end do
diri = "./"
fili2 = systemfunc("cd "+diri+" ; ls uhelen*nc")
print(fili2)
nfili = dimsizes(fili2)
f2 = addfiles (fili2,"r")
U2 = addfiles_GetVar(f2,fili2,"U")
lat2 = addfiles_GetVar(f2,fili2,"lat")
lon2 = addfiles_GetVar(f2,fili2,"lon")
lev_p2 = addfiles_GetVar(f2,fili2,"lev_p")
time2 = addfiles_GetVar(f2,fili2,"time")
printVarSummary( U2 )
printVarSummary( lat2 )
printVarSummary( lon2 )
printVarSummary( time2 )
printVarSummary( lev_p2 )
dimt2 = dimsizes( U2 )
ntim2 = dimt2(0)
klvl2 = dimt2(1)
nlat2 = dimt2(2)
mlon2 = dimt2(3)
print(nlat2)
uzon = dim_avg_Wrap(U2) ; uzon(time,lev,lat)
printVarSummary(uzon)
;***********************
; Create Plot
;***********************
d = 1
sm = 3
pct = 0.1
nfrq= ntim2/2
LAT = 65.0 ; latitude 65 degrees N
; SPC(lev,freq)
SPC = new( (/klvl2,nfrq/), typeof(U2),"No_FillValue")
do kl=0,klvl2-1
dof = specx_anal(uzon(lev_p|kl, {lat|LAT}, time|:),d,sm,pct)
SPC(kl,:) = dof@spcx
end do
SPC!0 = "lev_p"
SPC&lev_p = uzon&lev_p
period = 1./dof@frq
period!0 = "Period" ;
SPC!1 = "period"
SPC&period = period
printVarSummary(SPC)
printMinMax(SPC, True)
wks = gsn_open_wks ("pdf", "spec.alt.65lat.daily.164.7" ) ;
open workstation
gsn_define_colormap(wks,"gui_default") ; choose
colormap
res = True
res@cnFillOn = True
res@lbLabelAutoStride = True
res@gsnMaximize = True ; if [ps, eps, pdf] make large
res@gsnSpreadColors = True ; span color map
res@gsnCenterString = "Variance (m~S~2~N~ s~S~-2~N~)"
res@tiXAxisString = "Period (Earth days)"
res@tiYAxisString = "Pressure (mbar)"
res@pmTitleZone = 3
res@pmLabelBarOrthogonalPosF = 0.05
res@lbTitleOn = True
res@lbTitleDirection = "Across" ; title direction
res@lbTitlePosition = "Right"
res@lbTitleString = "(m2/s2)"
res@lbTitleFontHeightF = 0.02
res@lbTitleOffsetF = 0.02
res@cnFillOn = True
res@cnLineLabelsOn = False
res@lbOrientation = "Horizontal"
res@lbLabelAutoStride = True
res@trYReverse = True
res@gsnXAxisIrregular2Linear = True
res@gsnYAxisIrregular2Linear = True
plot = gsn_csm_pres_hgt(wks,SPC(lev_p | 0:20, period | :),res)
end
_______________________________________________
ncl-talk mailing list
List instructions, subscriber options, unsubscribe:
http://mailman.ucar.edu/mailman/listinfo/ncl-talk
This archive was generated by hypermail 2.1.8 : Tue Nov 30 2010 - 08:26:08 MST