Date: Mon Mar 28 2011 - 20:50:42 MDT
Hello
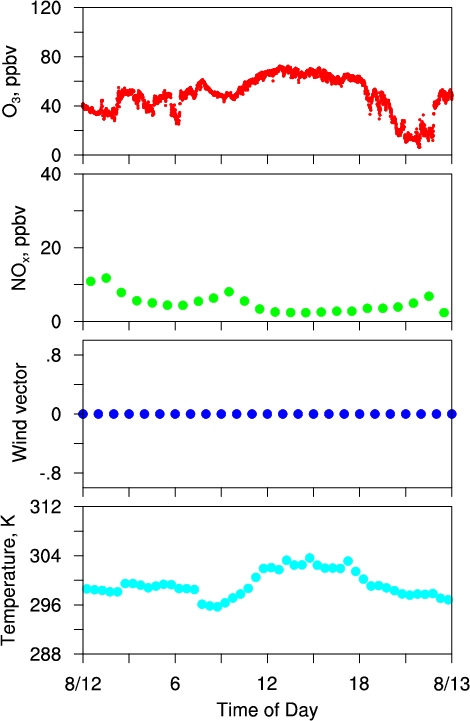
I would like to panel four plots like the figure attached. I used gsn_panel(wks,plot,(/dimsizes(variables),1/),pnlres) to make the panel plot.
I want to draw wind vector in the 3rd plots in the attached figure using "wmvect"
But I met some difficulty. See part of my code below. I need to comment out wmvect to make the figure attached.
If I don't comment out wmvect. The resulted figure just shows the wind vector, but not the other 3 plots in the figure.
Thanks
Xiaoming
plot(2) = gsn_csm_xy (wks,fspan(iday,iday+1,25),fspan(iday,iday+1,25)*0,res1) ; create plot
res1@gsnLeftString = "" ;files(ifiles)
res1@gsnRightString = "" ; "1999 Kwajalein"
wmsetp("vrs - reference vector size",12.9)
wmsetp("vrn - NDC size of a reference vector size",0.3)
wmsetp("vcc - vector color",1)
wmsetp("vcw - vector linewidth scale factor",4.)
y = Day_Hour_min_sec
y = (/0/)
pi = 3.1415926535
u =WSP*(- sin (WDR*pi/180))
v =WSP*(- cos(WDR*pi/180))
;printVarSummary(Day_Hour_min_sec)
index_start = min(time_index);(iday-211)*24+5
index_end = max(time_index);(iday-211+1)*24+5
; wmvect(wks, Day_Hour_min_sec(index_start:index_end:30), y(index_start:index_end:30), u(index_start:index_end:30), v(index_start:index_end:30) )
gsres = True ; Indicate you want to set some resources.
gsres@gsMarkerColor = 3 ; Change marker color.
gsres@gsMarkerSizeF = 20. ; Increase marker size by a factor of 20.
; wmvlbl(wks, 0.93 ,0.73)
_______________________________________________
ncl-talk mailing list
List instructions, subscriber options, unsubscribe:
http://mailman.ucar.edu/mailman/listinfo/ncl-talk