Date: Thu Sep 15 2011 - 14:31:13 MDT
Hi Mary,
I send you the script and the data.
The shapefile is:
http://biogeo.ucdavis.edu/data/diva/adm/COL_adm.zip
Thnaks for your help.
Best wishes,
Fernando
attached mail follows:
Fernando,
Can you provide me with your script and data? If so, you see our ftp information at http://www.ncl.ucar.edu/report_bug.shtml\
It looks to me like your lat/lon limits are still not correct.
--Mary
On Sep 14, 2011, at 2:48 PM, Luis Fernando Montana Roa wrote:
> Mary, I try your modification and suggests, the map perimeter is off but the shapefile is out of the contour
>
> Best regards
>
> Fernando
>
> From: Luis Fernando Montana Roa <lfmontanar@unal.edu.co>
> Date: September 14, 2011 2:44:47 PM MDT
> To: Mary Haley <haley@ucar.edu>
> Subject: Re: shapefile over contour
>
>
> Mary, I try your modification and suggests, the map perimeter is off but the shapefile is out of the contour
>
> Best regards
>
> Fernando
>
> ----- Original Message -----
> From: Mary Haley <haley@ucar.edu>
> Date: Tuesday, September 13, 2011 10:33 am
> Subject: Re: shapefile over contour
>
>> Hi Fernando,
>>
>> The reason why your shapefile doesn't fit your map is that the map
>> limits you selected are hard-coded, and you should probably use the
>> limits of the lat/lon data in the shapefile.
>>
>> It might be best to combine the function that attaches the
>> polylines with code that creates the map plot. This way, you can
>> get the min/max lat/lon from the shapefile and use this for the map.
>>
>> The line around the edge of your plot is the map perimeter. You can
>> turn this off by setting mpPerimOn to False.
>>
>> Please see the attached *untested* modification of your script.
>>
>> --Mary
> <ave.png>
>
>
>
> On Sep 12, 2011, at 10:30 PM, Luis Fernando Montana Roa wrote:
>
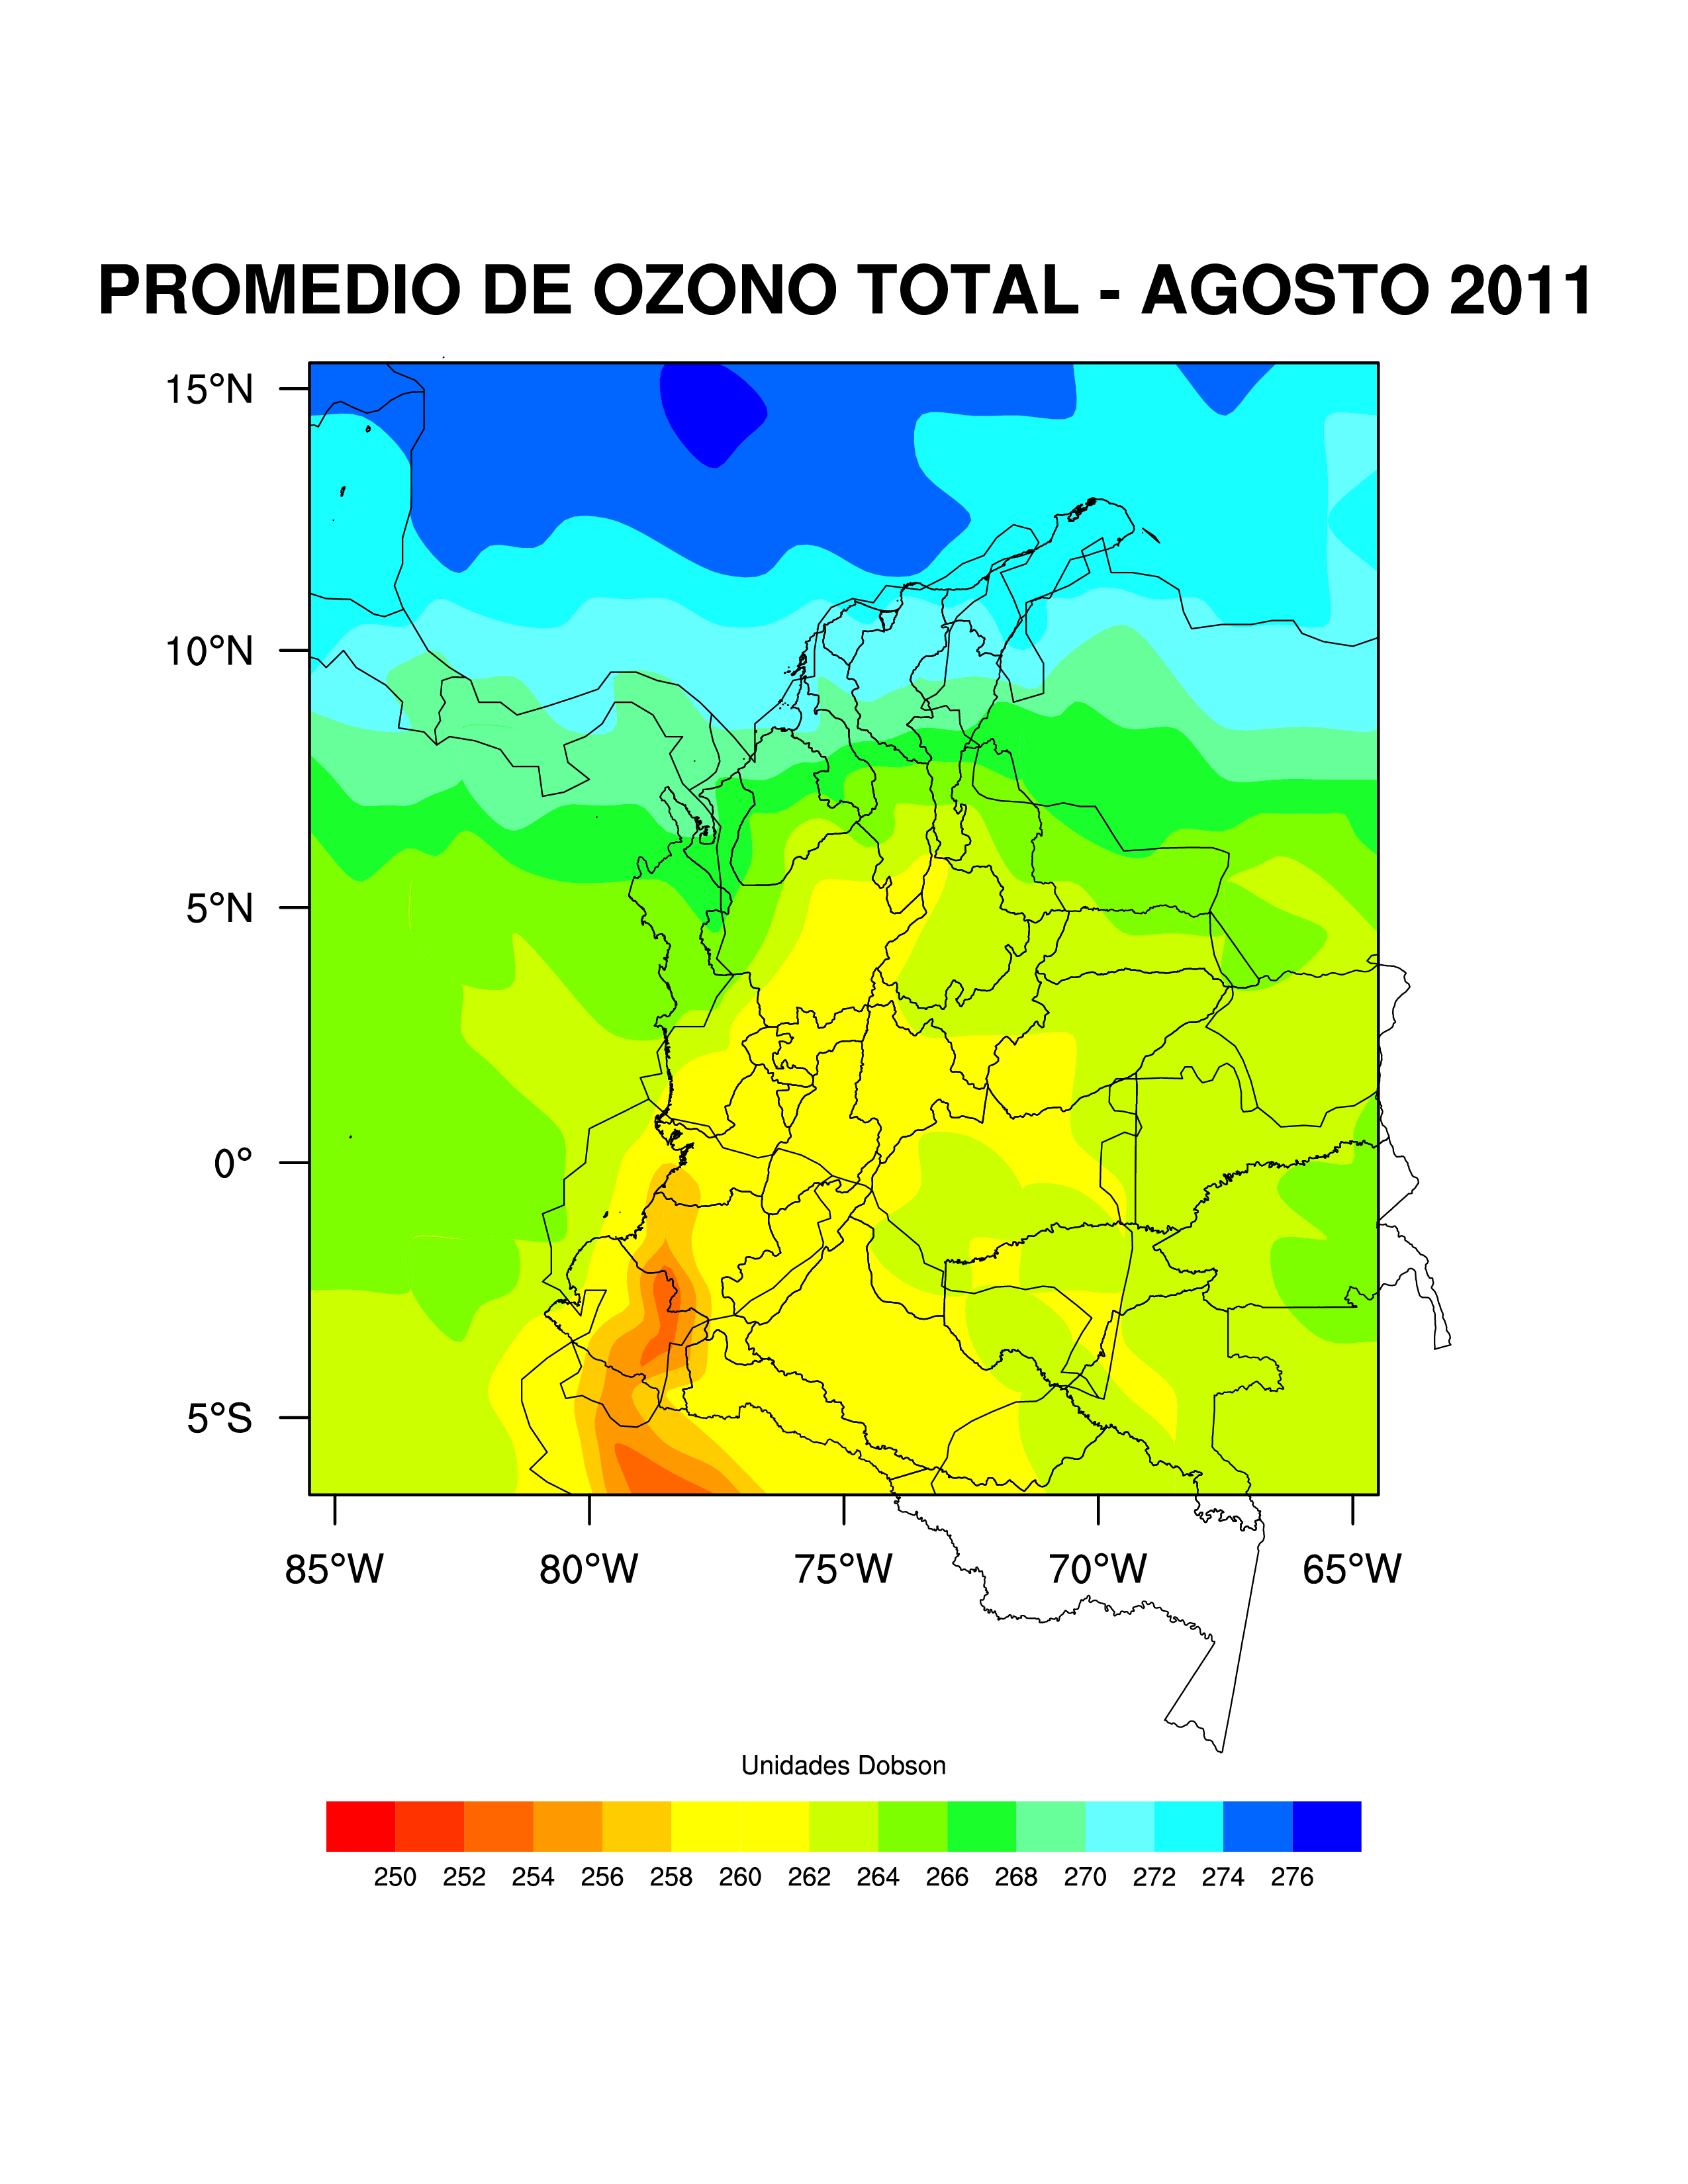
>> Hi, I'm plotting a shapefile over contour data, but the shapefile does not fit the contour map.
>> How can I fit the shapefile and how can I remove the line from the edge of the plot?
>>
>> The script and the output are attached.
>>
>> Any suggestions will be appreciated.
>>
>> Best wishes,
>>
>> Fernando
>>
>> <ave.ncl><ave.png>_______________________________________________
>> ncl-talk mailing list
>> List instructions, subscriber options, unsubscribe:
>> http://mailman.ucar.edu/mailman/listinfo/ncl-talk
>
>
>
> _______________________________________________
> ncl-talk mailing list
> List instructions, subscriber options, unsubscribe:
> http://mailman.ucar.edu/mailman/listinfo/ncl-talk
_______________________________________________
ncl-talk mailing list
List instructions, subscriber options, unsubscribe:
http://mailman.ucar.edu/mailman/listinfo/ncl-talk