Date: Thu Jan 19 2012 - 05:54:47 MST
> Message du 19/01/12 13:54
> De : elodyfluck@orange.fr
> A : "MaryHaley"
> Copie à :
> Objet : Re: [ncl-talk] longitudes array
>
> Thank you for your answer!
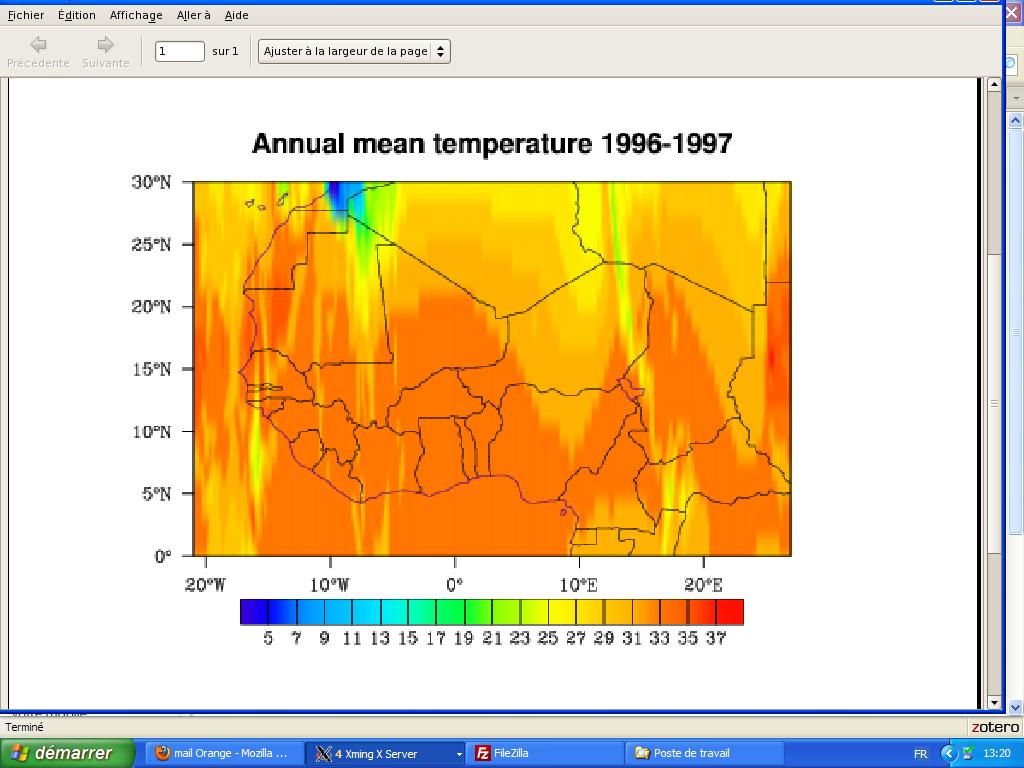
In fact, I'm trying to have an average of temperature at 2 meters (t2m) over West Africa during the period 1996-1997 using Reanalyses ERA INTERIM data. These data are monthly time scaled and parameters are given for the entire world, not for a specific array. My goal is to "zoom" on my studied area. I know that there a functions to do that; but NCL version is here 4.3.0; so I think that I'm limited about the functions to use.
I used "fspan" to specify my array, but I think that there are some other ways to select this area.
And the final goal is to have a plot from these temperatures overlayed with West Africa map..
I sent my NetCDF files on the ftp adress; in "incoming".
An image in .jpeg is join. This is the area that I would like to plot. Here, "avg_sahel_t" is dimensioned (21,240,2,12) to see the plot.
Thanks in advance for your ideas!
Elody
> Message du 19/01/12 00:26
> De : "Mary Haley"
> A : elodyfluck@orange.fr
> Copie à :
> Objet : Re: [ncl-talk] longitudes array
>
>
> On Jan 18, 2012, at 3:25 PM, elodyfluck@orange.fr wrote:
>
> > Thank you for your quick answer.
> >
> > The leftmost two dimensions of "avg_sahel_t" are (21 x 33) and the leftmost two dimensions of "v" are (21 x 240). How can I "convert" the "240" "v" dimensions into "21"?
>
> Well, I'm not sure, because I don't know how the 21 and the 240 dimension are related.
>
> You are doing some other things that I don't understand, like trying to assign a 2D coordinate array to a variable. You can only have 1D coordinate arrays attached to a variable.
>
> Can you provide your script and your data? If I can actually run it, then I might be able to figure out what you are trying to do.
>
> --Mary
>
>
> >
> > If avg_sahel_t is set to (21 x 240), the script runs without error message; but like I said my plot gives me 240 longitudes "compressed" in the zoomed area: I obtained averages for longitudes all over the world and not for my specific array: it looks like a spectrogram! (Latitudes are OK). How can I change that?
> >
> > Sorry if I'm not clear about that..
> >
> > Thanks in advance
> >
> > FLUCK Elody
> > Master Student
> > Centre de Recherche en Climatologie
> > Département Impacts climatiques/santé humaine
> > 21000 DIJON - FRANCE
> >
> >
> >
> >
> > > Message du 18/01/12 22:19
> > > De : "Mary Haley"
> > > A : elodyfluck@orange.fr
> > > Copie à : "ncl-talk [ncl-talk]"
> > > Objet : Re: [ncl-talk] longitudes array
> > >
> > > The error message is telling you that you are doing some calculation on the right-hand side that is return an array that is different than the array that you have on the left-hand side.
> > >
> > > Your "v" array is dimensioned lat x lon x time. Your "avg_sahel_t" array is dimensioned 21 x 33 x 2 12.
> > >
> > > You have to make sure, then, that the leftmost two dimensions of avg_sahel_t (21 x 33) are the same as the leftmost two dimensions as "v". Otherwise, you can't do the assignment:
> > >
> > > > avg_sahel_t(:,:,iy,im) = dim_avg_Wrap(v)
> > >
> > > --Mary
> > >
> > >
> > > On Jan 18, 2012, at 12:32 PM, elodyfluck@orange.fr wrote:
> > >
> > > >
> > > >
> > > >
> > > >
> > > >
> > > > > Message du 18/01/12 16:39
> > > > > De : elodyfluck@orange.fr
> > > > > A : "ncl-talk [ncl-talk]"
> > > > > Copie à :
> > > > > Objet : longitudes array
> > > > >
> > > > > Hi all NCL users,
> > > >
> > > > I'm a beginner in NCL language.I would like to have an average of t2m in multiple NetCDF files from ERA_INTERIM for a specific array: longitude{-21:27} and latitude{0:30}.
> > > > Here t2m has dimensions: (time,latitude,longitude). Longitudes are going from 0 to 360 (so I convert it in {-180:180} to specify my area), and latitudes goes 90 to -90.
> > > > With the script below, I cannot plot my desired area for the specific array but I have all longitudes "compressed" in region (0 to 30N; -21W to 27E).
> > > >
> > > > Version of NCL is 4.3.0.
> > > >
> > > > Any suggestion?
> > > > Thanks in advance
> > > > Elody
> > > >
> > > >
> > > >
> > > > load "$NCARG_ROOT/lib/ncarg/nclscripts/csm/gsn_code.ncl"
> > > > load "$NCARG_ROOT/lib/ncarg/nclscripts/csm/gsn_csm.ncl"
> > > > load "$NCARG_ROOT/lib/ncarg/nclscripts/csm/contributed.ncl"
> > > >
> > > > begin
> > > >
> > > >
> > > > avg_sahel_t = new((/21,33,2,12/),float)
> > > > yrs=(/"1996","1997"/)
> > > > yr=(/"96","97"/)
> > > > mns=(/"01","02","03","04","05","06","07","08","09","10","11","12"/)
> > > >
> > > > do iy = 0,1
> > > > do im = 0,11
> > > > f = addfile("/archive/crct/shared/ERA_INTERIM/SURFACE"+"/erai_sfc_"+yrs(iy)+"_" +mns(im)+".nc","r")
> > > > print(iy+" "+im)
> > > >
> > > > var = f->t2m(:,{0:30},:)
> > > > ;printVarSummary(var)
> > > > v = var(latitude|:,longitude|:,time|:)
> > > > ;printVarSummary(v)
> > > >
> > > > lat2d = f->latitude
> > > > lon2d = f->longitude
> > > > mlon = 240
> > > > lon = lonGlobeF(mlon,"lon2d","longitude","degrees_east")
> > > > lon = (/lon-180./)
> > > > lon&lon2d = lon
> > > > ;print(lon)
> > > >
> > > > minlon = -21
> > > > maxlon = 27
> > > > olon = 33
> > > >
> > > > lon1 = fspan(minlon,maxlon,olon)
> > > > lon1@units = "degrees_east"
> > > > ;print(lon1)
> > > >
> > > > v!0 = "lat2d"
> > > > v!1 = "lon1"
> > > > v@lon1 = lon1
> > > > printVarSummary(v)
> > > > avg_sahel_t!0 = "lat2d"
> > > > avg_sahel_t!1 = "lon1"
> > > > avg_sahel_t(:,:,iy,im) = dim_avg_Wrap(v) : fatal:Dimension size mismatch on subscript #1, left-hand and right-hand side dimensions do not match
> > > > printVarSummary(avg_sahel_t)
> > > > delete(f)
> > > > delete(var)
> > > > delete(v)
> > > > end do
> > > > end do
> > > >
> > > > vv = dim_avg_Wrap(dim_avg_Wrap(avg_sahel_t))*0.001554884
> > > >
> > > > printVarSummary(vv)
> > > > print(min(vv)+" "+max(vv))
> > > >
> > > >
> > > > wks = gsn_open_wks("ps","sahel2")
> > > > setvalues wks
> > > > "wkColorMap" : "rainbow"
> > > > end setvalues
> > > >
> > > > res = True
> > > > res@cnLinesOn = False
> > > > res@cnFillOn = True
> > > > res@cnLineLabelsOn = False
> > > >
> > > > res@cnRasterModeOn = True
> > > > res@gsnAddCyclic = False
> > > > ;Zoom in Sahel
> > > > res@mpLimitMode = "LatLon"
> > > > res@mpMinLatF = -90
> > > > res@mpMaxLatF = 90
> > > > res@mpMinLonF = -180
> > > > res@mpMaxLonF = 180
> > > >
> > > > res@mpCenterLonF = (res@mpMaxLonF-res@mpMinLonF)/2
> > > >
> > > > res@tfDoNDCOverlay = True
> > > >
> > > > res@mpGeophysicalLineColor = 2
> > > > res@mpPerimOn = True
> > > > res@mpGridLineDashPattern = 2
> > > > res@mpOutlineBoundarySets = "AllBoundaries"
> > > > res@mpUSStateLineColor = "black"
> > > > res@pmTickMarkDisplayMode = "Always"
> > > > res@pmLabelBarWidthF = 0.6
> > > > res@pmLabelBarHeightF = 0.1
> > > > res@lbLabelFontHeightF = 0.013
> > > >
> > > > res@cnLevelSelectionMode = "ExplicitLevels"
> > > > res@cnLevels =(/5,7,9,11,13,15,17,19,21,23,25,27,29,31,33,35,37/)
> > > > res@cnFillColors=(/12,23,45,52,57,62,73,89,98,128,136,147,152,157,160,170,175,186/)
> > > > ;res@cnFillColors=(/12,23,45,52,57,62,73,89,98,128,136,147,152,157,160,170,175,186/)
> > > >
> > > > res@tiMainString = "Annual mean temperature 1996-1997"
> > > >
> > > > plot = gsn_csm_contour_map(wks,vv,res)
> > > >
> > > >
> > > > end
> > > >
> > > > PrintVar Summary of v gives:
> > > >
> > > > Variable: v
> > > > Type: short
> > > > Total Size: 1249920 bytes
> > > > 624960 values
> > > > Number of Dimensions: 3
> > > > Dimensions and sizes: [lat2d | 21] x [lon1 | 240] x [time | 124]
> > > > Coordinates:
> > > > lat2d: [ 0..30]
> > > > lon1: [ 0..358.5]
> > > > time: [841512..842250]
> > > > Number Of Attributes: 7
> > > > lon1 :
> > > > long_name : 2 metre temperature
> > > > units : K
> > > > missing_value : -32767
> > > > _FillValue : -32767
> > > > add_offset : 262.5528775112522
> > > > scale_factor : 0.001703177224306923
> > > >
> > > > _______________________________________________
> > > > ncl-talk mailing list
> > > > List instructions, subscriber options, unsubscribe:
> > > > http://mailman.ucar.edu/mailman/listinfo/ncl-talk
> > >
> > >
>
>
_______________________________________________
ncl-talk mailing list
List instructions, subscriber options, unsubscribe:
http://mailman.ucar.edu/mailman/listinfo/ncl-talk